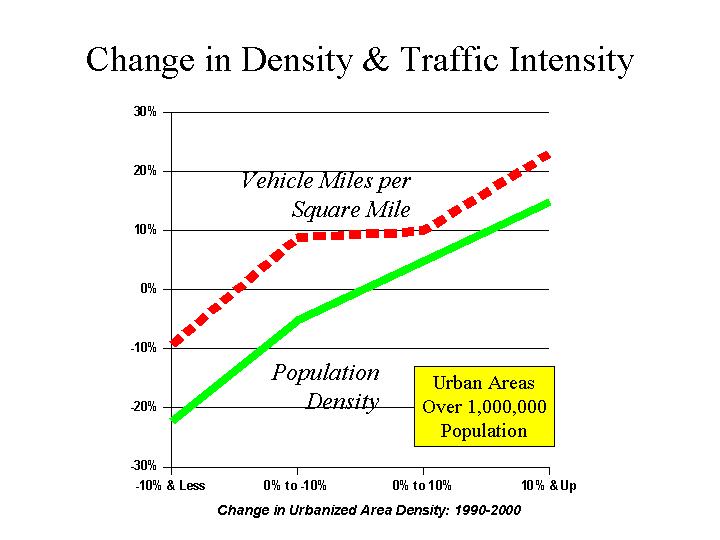
Traffic Intensity and Density:
Trend in Largest US Urban Areas: 1990-2000

Change in Density Cases 2000 Density/1990 Density 2000 Traffic Intensity/1990 Traffic Intensity Traffic Intensity Change/Density Change
Over 10% 6 1.15 1.23 1.07
0% to 10% 14 1.05 1.10 1.06
0% to -10% 12 0.95 1.09 1.15
-10% or Less 8 0.78 0.91 1.16
Total 40 0.98 1.08 1.10
Traffic Intensity: Vehicle Miles per Square Mile of Urbanized Land Area.
Calculated from Texas Transportation Institute Data for 2000 and 1990, urban areas over 1,000,000 population
Linear regression result: 0.82 increase in traffic intensity per 1.00 increase in density (constant 0.27). R2=0.75, Significant at 99 percent confidence level


The Public Purpose: One of National Journal's Top 4 Transport Internet Sites
 NAVIGATION & PUBLICATION SERIES
NEW ITEMS
The Public Purpose
Demographic Briefs
Government Cost Review
Gov't Employment Fact Book
Highway & Motorway Fact Book
HOME
Intercity Transport Fact Book
Labor Market Reporter
Realities
School Transport Fact Book
Transport Fact Book
BOOK STORE
Urban Policy
Urban Transport Fact Book
Competitive Tendering Website
Intl Comp. & Ownership Conference
Alternatives to Light Rail in Seattle

 WEB SITE INFORMATION
Contact by E-Mail
Subscribe (Free)
Corrections Policy & Rights

The Public Purpose     WENDELL COX CONSULTANCY     Demographia
P. O. Box 841 - Belleville, IL 62269 USA
Telephone: +1.618.632.8507 - Facsimile: +1.775.521.8564
To facilitate the ideal of government as the servant of the people by identifying and implementing
strategies to achieve public purposes at a cost that is no higher than necessary.

(c) 2002 www.publicpurpose.com --- Wendell Cox Consultancy --- Permission granted to use with attribution.