|
TABLE OF CONTENTS
Abstract 1
Summary of Conclusions 2
1. Introduction 9
2. Local Circulation Transit Systems 10
3. The Uniqueness of Las Vegas 10
4. US and International Ridership Projection Reliability 11
5. High Volume Projections: The Record 13
6. The LLC Monorail Ridership Projection: Optimistic Foundations 15
7. Ridership Increases to Fare Increases (Elasticity) 17
8. Comparison to the Las Vegas Strip Bus Route 18
9. LLC Monorail Ridership from the Bus 19
10. LLC Monorail Ridership Attracted from the Existing Monorail 19
11. LLC Monorail Ridership Attracted from Walking 22
12. LLC Monorail Ridership Attracted from Taxicabs 24
13. Comparison to Other Local Circulators 25
14. Fare Recovery Ratio 27
15. Hotel Generation Model 29
16. Advertising Revenues 30
17. Operating and Capital Costs 30
18. Additional Issues 32
19. Revised Ridership and Revenue Projections 33
20. Impact on Riders and Taxpayers 38
21. Issues Raised by the April 2000 Projections 39
Appendices 43
1: US Rail Systems: Annual Boardings per Route Mile
2.: Rail Systems in High Auto Use Nations
3: Fare Recovery Ratios: Major US Transit Systems
4: Cash Flow Analysis: Project Projection as Submitted
5: Cash Flow Analysis: Revised: High Projection
6. Cash Flow Analysis: Revised: Low Projection
ABSTRACT
Using available data, this study analyzes the ridership and revenue projections for
monorail proposed by MGM Grand-Bally's Monorail LC (the "LLC Monorail"). This 2d
Edition of the report contains updated information and analysis based upon new
projections provided by the project sponsors through April 2000. It is concluded that:
Daily ridership is likely to be in the range of 16,900 to 25,400 in 2004, compared
to the projected 53,500 (53 to 68 percent below the LLC Monorail projection).
Net cash flow over the project operating horizon (2003-2035) is likely to be in the
range of minus $1.000 billion to minus $1.705 billion. This compares to the LLC
Monorail projection of plus $534 million.
Project revenues are unlikely to be sufficient to pay project obligations during all
but two years of operation, from 2003 through 2035.
Project reserves are likely to be exceeded by accumulated cash flow deficits
beginning during 2006 or 2007. This could result in a default.
Local taxpayers, state taxpayers and riders could be at risk in three ways:
Diversion of tourist passengers from the Las Vegas Strip route to the LLC
Monorail could reduce cross-subsidies to other RTC routes, necessitating
service reductions or higher taxes.
It is intended that the LLC Monorail will be operated cooperatively with a to be
developed RTC fixed guideway from the north terminal to Cashman Field. A
financial failure on the part of the LLC Monorail could lead to circumstances
under which higher taxes might be sought to continue operation of the LLC
Monorail as a part of the RTC system.
In the event of a financial failure, the state could face higher bond interest rates,
which would raise the cost of debt to state taxpayers.
As is the case with respect to all projections, factors such as the state of the economy,
Las Vegas' uniqueness as a tourist destination and many others could generate actual
results that are above or below these forecasts.
SUMMARY OF CONCLUSIONS
This study analyzes the ridership and revenue projections for a monorail proposed by
MGM Grand-Bally's Monorail LC (the "LLC Monorail"), which will replace the current
MGM Grand to Bally's monorail and extend the route. This 2d Edition of the report
contains updated information and analysis based upon new projections provided by the
project sponsors through April 2000. Project consultants forecast that this system would
carry 53,525 daily riders in 2004 (the first full year of operation) and would earn a net
profit of nearly $534 million between 2003 and 2035. In 2003, the average fare per one
way trip would be $2.50.
The New Projections: There are substantial changes in the new information and
projections provided in 2000 by the project sponsors. The purchase price of the existing
monorail has increased 25 percent, and the fees to be charged by the management
company have increased 250 percent. The budget and staffing plan for the
management company leads to the conclusion that the four executives will be paid
nearly one-half million dollars annually in salaries and benefits. Operating expenses
have increased 44 percent. The starting average fare (2003) has been increased from
$2.00 to $2.50 and fare revenues are projected to increase 31 percent. The cost
increases are considered highly questionable and the revenue increase is considered
unachievable. Each of these changes from projections supplied in 1999 would appear
to make the project less viable financially.
The very significant revisions that have occurred in the projections between the original
submittals to the state and the latest are cause for concern. In a period of just six
months, the starting fare has been increased by 25 percent, the sale price of the
existing monorail has risen 25 percent, and the management fee has risen 250 percent.
It is inconceivable that any circumstances have changed during this short period of time
that would require adjustments of such significance. These inconsistencies could cast
doubt on the seriousness and reliableness of the analysis that produced the projections
(Section 21).
Revised Analysis: The basic conclusion of this study is that the LLC Monorail is
unlikely to achieve its ridership projections, revenue projections or financial obligations.
Specific findings are as follows:
The LLC Monorail is a local circulation system, similar in technology and function
to downtown people movers and monorails in Seattle, Miami, Jacksonville and
Detroit (Section 2).
Because of its high tourist attraction and gaming, Las Vegas is a unique
environment. Some differences will tend to be favorable toward LLC Monorail
performance, while others will not. (Section 3).
US and international ridership projections for projects similar to the LLC Monorail
have often been overly optimistic (Section 4).
The problem of inaccurate forecasts have been particularly acute with respect to
systems projected to carry high passenger volumes. On average, actual
ridership has averaged more than 70 percent below projections, with the most
favorable result being a 28 percent negative error. The LLC Monorail is projected
to be such a high volume system (Section 5).
The ridership projections for the LLC Monorail rely substantially on the
projections developed for the proposed Regional Transportation Commission
(RTC) fixed guideway system. These projections are exceedingly optimistic, at
ridership levels high among western European, North American and Australasian
systems. The RTC projections are among the most aggressive in US transit
history and could emerge as among the least accurate. The LLC Monorail is
projected to carry virtually the same or more passengers per route mile than the
New York subway, the London Underground and the Stockholm Metro, and more
than double that of the most heavily used new rail systems in the United States.
It is not likely that such an intensity of ridership would be attracted. (Section 6)
The LLC Monorail projections assume that ridership would be considerably less
sensitive to fare increases than the national experience (fare elasticity). If
ridership falls in reaction to fare increases at the national rate, while all other LLC
Monorail assumptions are preserved, the LLC Monorail would earn two-thirds
less net income from 2003 to 2035 (Section 7)
The Las Vegas Strip Bus route (#301) carries more than 10,000 tourist trips
daily. On a route mile basis the LLC Monorail is projected to carry more than four
times the ridership of the bus route (Section 8).
The LLC Monorail projects that approximately 500 riders will switch from the bus
route to the LLC Monorail. This means that more than 53,000 daily riders would
be attracted from other modes, such as the existing monorail, taxicabs and
walking. (Section 9).
The LLC Monorail is projected to attract one-third of its ridership from the existing
monorail that operates between the MGM Grand Hotel and Bally's. This is more
ridership than is currently carried on the existing monorail. Moreover, the existing
monorail charges no fare. It is likely that charging the $2.50 fare level would
reduce the potential passenger attraction from the existing monorail to between
5,300 and 7,900 daily, not the 18,000 used in the LLC Monorail projections
(Section 10).(1)
The LLC Monorail is projected to attract one-third of its ridership from walking
trips. However, the LLC Monorail would provide little or no travel time advantage
for most walking trips. Further, walking is not simply a method of traveling from
an origin to a destination. The Las Vegas Strip is one of the most visually
stimulating street scapes in the world, which is an important reason why walking
is the most popular mode of travel among Las Vegas Strip visitors (Section 11).
The LLC Monorail is projected to attract 20 percent of its ridership from taxicabs.
This seems highly optimistic, because the LLC Monorail will provide virtually no
travel time advantage. Moreover, taxicab users tend to be less price sensitive
and are not likely to be attracted by the lower LLC Monorail fares (Section 12).
The LLC Monorail is projected to have daily ridership far above the levels
achieved by other local circulator systems in two-dimensional(2) dense downtown
areas, despite charging a much higher average fare. This is not likely to be
achievable (Section 13).
The LLC Monorail is projected to have a fare recovery ratio (fare revenues
divided by operating costs exclusive of debt service and taxes(3)) that is 280
percent of any other transit system in the United States and nine times average.
This seems optimistic (Section 14).
According to the LLC Monorail Ridership and Revenue Study, there is a
correlation between the number of hotel rooms and existing monorail ridership.
Based upon the higher number of rooms that will be in hotels adjacent to LLC
Monorail stations the daily ridership potential is approximately 34 percent lower
than projected, assuming a $0.00 fare. The $2.50 average fare is expected to
reduce ridership demand (Section 15).
Advertising revenues appear to be exceedingly high and could be 50 percent to
90 percent lower than projected. A 50 percent reduction in advertising revenue
would reduce net cash flow nearly one-half between 2003 and 2035 (Section
16).
As in the case of ridership projections, both US and international capital and
operating cost projections have often been unreliable. Such cost overruns could
have a negative impact on the financial performance of the LLC Monorail project.
(Section 17).
Additional issues include a potential delay to comply with federal environmental
regulations due to possible project integration with the RTC fixed guideway
system and the potential for competition should a continuous monorail (or more
continuous monorails) be developed on the west side of the Las Vegas Strip
(Section 18).
Based upon the analysis above, two alternative projections were prepared and
compared to the projections supplied by the LLC Monorail proponents. Both
Projection #2 and Projection #3 are substantially below the Proponent's
Projection (#1). The principal reason for the differences is that the proponent's
consultants have considerably lower fare elasticity factors and made far more
optimistic assumptions for the ridership level that would be attracted at the
comparatively high average starting fare.
Projection #1, the Proponent's Projection, is as supplied by the LLC
Monorail project sponsors.
Projection #2, the Optimistic Ridership Projection, adjusted for the
impact of the $2.50 average fare using the LLC Monorail fare elasticity
factor of -0.20., This projection accepts all other LLC Monorail
assumptions, including the aggressive advertising revenue projection and
the LLC Monorail fare elasticity factor for subsequent fare increases
between 2003 and 2034. Projection #1 assumes no capital or operating
cost overrun. This projection yields 25,400 daily passengers in 2004, 53
percent below the 53,500 LLC Monorail projection. Between 2003 and
2035, a net negative cash flow of 36 percent (minus $1.000 billion) would
occur. Compared to the Proponent's Projections (#1), a negative cash
flow result of $1.5 billion would occur. Revenues would be insufficient to
pay obligations for all but two years from 2003 to 2035. The projected
accumulated would be greater than debt service reserves and the general
fund from 2007.
Projection #3, the Conservative Ridership Projection, is considered to
be the most likely scenario. Projection #3 adjusts for the impact of the
$2.50 fare, using the national -0.36 fare elasticity factor. This projection
downwardly adjusts advertising revenues, uses the national fare elasticity
factor for fare increases between 2003 and 2035, and assumes a 10
percent operating cost overrun. Projection #2 assumes no capital cost
overrun. Between 2003 and 2035, a net loss of 60 percent ($1.705 billion)
would occur. Compared to the Proponent's Projections (#1), a negative
cash flow result of $2.2 billion would occur. Revenues would be
insufficient to pay obligations in all years from 2003 to 2035. The
projected accumulated would be greater than debt service reserves and
the general fund from 2006 (Figure #1 and Table).

The LLC Monorail could not financially survive the smallest ridership projection
error that has been typical of high volume fixed guideway projects. If project
revenue (fares and advertising) is as little as 11 percent short, the LLC Monorail
would be incapable of meeting its financial obligations, even if all other project
projections and assumptions proved accurate. Virtually no ridership projection
for a high volume fixed guideway project has been accurate enough that if
achieved in Las Vegas would enable the LLC Monorail to meet its financial
obligations. Ridership projections for high volume fixed guideways have had an
average error of 72 percent, and the most accurate has been an error of 28
percent (Section 4).
From the information available, it is likely that there is a considerable risk that the
LLC Monorail will be unable to meet its ridership projections, revenue projections
or financial obligations (Section 19).
| Summary of Projections |
|
Projection #1
Proponents
(as supplied
by LLC
Monorail) |
This Study |
| Projection #2
Optimistic
Ridership |
Projection #3
Conservative
Ridership |
| Daily Ridership: 2004 |
53,525 |
25,363 |
16,924 |
| Comparison to #1 |
-- |
-52.6% |
-68.4% |
| Daily Ridership: 2035 |
64,482 |
26,751 |
15,872 |
| Comparison to #1 |
-- |
-59.5% |
-75.4% |
| Planned Net Cash Flow: 2003-2035 (Millions) |
$534 |
$534 |
$534 |
| This Case Net Cash Flow: 2003-2035 (Millions) |
$534 |
($1,000) |
($1,705) |
| Variation: 2003-2035 (Millions) |
$0 |
($1,533) |
($2,239) |
| Fare Recovery Ratio: 2003-2035 |
280.0% |
122.7% |
70.6% |
| Revenues/Expenses: 2003-2035 |
19.3% |
-36.0% |
-59.9% |
| Years Financial Obligations Met by Cash Flow |
33 of 33 |
2 of 33 |
0 of 33 |
| First Year Financial Obligations Not Met by Cash Flow |
NA |
2004 |
2003 |
| Year Negative Result Exceeds Reserves & Funds |
NA |
2007 |
2006 |
Local taxpayers, state taxpayers and riders could be at risk in three ways:
While the LLC Monorail is projected to attract only one percent of its
ridership from the Las Vegas Strip Route (#301), there is the potential that
higher diversion could threaten the fiscal viability of the RTC bus system.
Route #301 has by far the highest fare recovery ratio in the RTC system.
The riders who would be diverted are likely to be full fare paying tourists,
which would reduce the fare recovery ratio, making it necessary to either
reduce service (on the Strip route or on other routes) or raise taxes.
It is intended that the LLC Monorail will be operated cooperatively with a
to be developed RTC fixed guideway from the north terminal to Cashman
Field. A financial failure on the part of the LLC Monorail could lead to
circumstances under which higher taxes might be sought to continue
operation of the LLC Monorail as a part of the RTC system.
In the event of a financial failure, the state could face higher bond interest
rates, which would raise the cost of debt to state taxpayers (Section 20).
As is the case with respect to all projections, factors such as the state of the economy,
Las Vegas' uniqueness as a tourist destination and many others could generate actual
results that are above or below these forecasts.
1. INTRODUCTION
This report has been revised to reflect the April 2000 projections of the
proponent's consultants. The changes from the previous projections are
summarized in Section 21.
A monorail is proposed for development by MGM-Grand-Bally's Monorail LC (the LLC
Monorail). The LLC Monorail is a public transit fixed guideway(4) that would operate in the
Las Vegas Strip area, over a 3.9 mile route(5) from the MGM Grand Hotel to the Sahara
Hotel. It would be generally placed behind the hotels and casinos on the east side of
the Las Vegas Strip. It is projected that up to nine trains of four monorail cars would
operate, up to every 3.9 minutes during peak travel periods.(6) The average one-way fare
per passenger would be $2.50, and increased $0.25 every three years. It is projected
that the LLC Monorail would carry 53,50 riders a day in 2004(7) (19.536 million
annually).(8) In the longer term, the LLC Monorail could be integrated with the proposed
Regional Transportation Commission (RTC) fixed guideway system.
This study analyzes the planning documents prepared for the LLC Monorail project,
especially with respect to ridership and revenues. The source documents are project
planning documents, especially the annual financial projections (Draft Analysis Base
Case) and the Ridership and Revenue Study. The LLC Monorail operating revenue and
cost projections are recreated in Table A-4 (Appendix).
2. LOCAL CIRCULATION TRANSIT SYSTEMS
The LLC Monorail is similar in technology, operating environment and customer market
to systems that have been built in Miami, Detroit, Jacksonville and Seattle. The primary
function performed by these systems is to provide local circulation within a fairly small
area --- usually a downtown area, or in the case of Las Vegas, the tourist oriented Las
Vegas Strip.
The Miami system (Metromover) is unique in being a part of a larger regional
metro (elevated) rail system. As a result Miami's Metromover attracts not only
circulation trips within downtown, but is also used by commuters to begin or
complete their journey to work.
The Seattle system is a monorail that was built for the 1962 World's Fair.
The Jacksonville system (Skyway) is a monorail that is similar in technology to
the proposed LLC Monorail.
The Detroit and Miami systems are fully automated people movers (not
monorails), with rail vehicles operating on elevated tracks.
3. THE UNIQUENESS OF LAS VEGAS
Las Vegas is a unique environment. With a majority of the world's largest hotels, the
Las Vegas Strip represents one of the most geographically concentrated tourist
destinations. Some characteristics of Las Vegas' uniqueness would seem to auger well
for LLC Monorail ridership.
There is a large concentration of both hotel rooms and casinos.
The Las Vegas Strip bus route carries 10,000 daily tourist riders at a $2.00 fare.
There is a tendency on the part of tourists to visit more than one casino, which
could translate into LLC Monorail demand.
Visitors have a comparatively high discretionary amounts for spending.
Other factors of Las Vegas' uniqueness, however, are not positive with respect to the
potential for LLC Monorail ridership.
The gaming industry is very competitive. The casinos that are not directly served
by the LLC Monorail are likely to respond quickly and effectively to any threat of
losing business to locations that are directly served.
The existing market for transit along the Las Vegas Strip, while large in relation
to the bus route, is comparatively small in relation to the overall tourist travel
market along the Las Vegas Strip.
The Las Vegas Strip is one of the most visually striking built environments in the
world and is the locus of outdoor activity in the area. As a result, walking
represents by far the largest amount of tourist trips along the Las Vegas Strip.
The LLC Monorail, however, would operate behind the hotels on the east side of
the Las Vegas Strip.
The Las Vegas Strip does not have the land use patterns (such as a two-dimensional development(9)) and employment base that is generates much of the
ridership in the dense downtown areas in which local circulators operate (such
as for lunch trips).
4. US AND INTERNATIONAL RIDERSHIP PROJECTION RELIABILITY
The greatest portion of LLC Monorail revenues would be paid by customers riding the
system. As a result, the reliability of the passenger projections is crucial.
Ridership projections for new fixed guideway systems have been comparatively
unreliable. Urban fixed guideway projects have consistently attracted fewer passengers
and generated less passenger revenue than projected. With respect to federally
financed projects opened in the 1980s, ridership averaged 59 percent below
projections.(10)
Some of the most inaccurate ridership projections have occurred with respect to local
circulator projects similar to the proposed LLC Monorail.
Miami's Metromover (people mover) was projected to carry 41,800 riders daily by
1988 and missed its projection by nearly 75 percent. The system is carrying
13,400 daily riders in 1999 --- 68 percent below projection despite a more than
doubling of the route's length.(11)
Jacksonville's downtown monorail was to have carried 10,000 daily riders in its
original alignment and 38,000 when completed. In 1996 the monorail was
carrying under 1,000 daily riders --- 90 percent below the 10,000 projection.(12)
The system has since been nearly tripled in length, and ridership has risen to
1,800. Two new stations will be added to the present seven in 2000. It seems
doubtful that ridership on the completed system will reach 2,500 and that the
38,000 daily ridership projection will be missed by more than 90 percent.
Detroit's downtown people mover was projected to carry 67,700 daily riders in
the late 1980s. In 1996, the system carried fewer than 7,000 daily riders,
approximately 90 percent below the projection.(13)
A recent National Academy of Sciences report evaluated the international experience in
transportation system projections (such as fixed guideways) and found:(14)
Traffic forecasts that are off by 20 to 60 percent when compared with actual
development are frequent in large transportation projects.
At the same time, some mass transit projects have been successful in projecting
ridership, such as the San Diego light rail line and the Los Angeles Blue Line light rail
line. Each of the few successful rail projections has been conservative --- not a high
volume projection (Section 5).
5. HIGH VOLUME FORECASTS: THE RECORD
The experience, however, with high volume ridership projections has been uniformly
unsuccessful. The most inaccurate ridership projections have occurred with respect to
systems projected to carry more than one million annual passengers per route mile.(15)
Virtually no such projection has been close to accurate.
Perhaps the most unreliable fixed guideway related transit system ridership projections
occurred in Miami, where that city's metro rail system was to have carried 240,000 daily
riders.(16) Actual ridership fell 85 percent short, and a decade later carries less than
50,000 daily riders --- still approximately 80 percent below projection. Overall, Metro
Dade's consultants projected at least 300 percent bus and rail higher ridership than
occurred. The Miami system projections became a national "laughing stock" and
attracted the attention of a weekly presidential radio address, when President Reagan
noted that it would have been less expensive to lease each new passenger a limousine.
Similar problems have occurred with respect to projects opened in the 1990s. For
example, the Los Angeles "Green Line" was projected to carry 65,000 daily
passengers in 1994 and 103,000 by 2003.(17) Actual ridership was less than 20,000 in
1997, three years and 70 percent behind projection.(18) However, in response to ridership
shortfalls, transit agencies have become more conservative in their ridership projections
by reducing ridership estimates shortly before system openings or simply projecting
lower ridership earlier in the planning process.
Among the high volume projections, the average error has been 72.2 percent, and the
smallest projection error was 27.7 percent in Washington, DC (Table #1). The LLC
Monorail is projected to carry ridership of 5.1 million passengers per route mile and is
therefore near the high end of the range of heavy ridership projections that have been
characterized by chronic inaccuracy.
|
Table #1
Projected and Actual Ridership per Route Mile: High Volume Fixed Guideway Systems |
System |
Annual Ridership per
Route Mile (Millions) |
Variation |
| Projected |
Actual |
| Baltimore Metro |
4.0 |
1.7 |
-58.6% |
| Buffalo Light Rail |
4.3 |
1.4 |
-68.3% |
| Detroit Downtown People Mover |
7.0 |
1.2 |
-83.3% |
| Jacksonville Monorail |
5.0 |
0.5 |
-90.0% |
| Los Angeles Green Line Light Rail |
1.3 |
0.4 |
-69.2% |
| Los Angeles Metro |
7.4 |
2.1 |
-71.8% |
| Miami Metro |
3.4 |
0.5 |
-85.2% |
| Miami Downtown People Mover |
6.2 |
1.6 |
-73.7% |
| Pittsburgh Light Rail |
2.6 |
0.9 |
-66.2% |
| Washington Metro |
2.8 |
2.0 |
-27.7% |
| Average |
4.4 |
1.2 |
-72.2% |
Includes systems for which annual projected ridership per route mile was more than one
million.
Los Angeles data compares the original projection with the most recently released
projection, based upon the lower rate of usage on segments already opened.
Sources: Calculated from Pickrell, National Transit Database, Los Angeles County
Transportation Commission and Federal Transit Administration "3j" reports. |
The state of the ridership forecasting art has simply not advanced to the point that high
volume projections are reliable. For example, recent media reports have indicated that
the new Hudson-Bergen light rail line in northern New Jersey is falling 80 percent short
of its first year projections.(19) Perhaps the most important reason that major transit
facility ridership projections have not improved is that there is no compelling reason.
Transit projections have not been prepared for the genuine investment purposes.
Transit ridership projections have largely been used to justify allocation of federal
funding or to promote transit projects to local officials or voters. When the projected
passengers fail to materialize, no individual investor loses money. Government
agencies simply make up the deficit with subsidies. Moreover, transit projects rely only
to a small degree on passenger fares. Virtually all transit facilities rely on government
subsidies for 100 percent of their operating costs and a large percentage of their
operating costs. Current transit ridership modeling is not designed to predict results on
a basis that can be reasonably relied upon by private investors with money at risk.
6. THE LLC RIDERSHIP PROJECTION: OPTIMISTIC FOUNDATIONS
The LLC Monorail ridership projection is based upon a modification of the Regional
Transportation Commission's (RTC) projections for its "Resort Corridor Major
Investment Study," which anticipates construction of an 18 mile long fixed guideway.
RTC's consultants projected daily ridership of 331,000 in 2020. The Las Vegas route
would carry more than five times the ridership of any other single route fixed guideway
system in the nation. The 2020 ridership projection would make the Las Vegas RTC
system the most intensively used rail (guideway) system in the US, exceeding the
boardings per line mile of all systems operating in the United States (Table #A-1,
Appendix)
The guideway would be 23.1 percent more intensively patronized than the New
York City subway system and 373 percent more intensively used than the
Chicago Transit Authority's elevated system (these are higher volume heavy rail
or metro systems, as opposed to light rail or monorail systems).
The guideway ridership would be substantially more intensively patronized than
the most highly patronized new (post 1970) rail systems --- 177 percent more
intensively used than Washington's Metro and 474 percent more intensively
used than San Francisco's BART (these are higher volume heavy rail or metro
systems, as opposed to light rail or monorail systems).
Guideway ridership intensity would be seven times or more that of St. Louis, San
Diego and Portland, which are considered the most successful new light rail
systems in the nation.
Moreover, the RTC fixed guideway boardings per line mile would rank Las Vegas fifth
among systems in highly automobile dependent countries of Western Europe, Australia,
New Zealand, Canada and the United States (Table #A-2, Appendix).
Las Vegas would rank behind only Vienna, Paris, Rome and Milan
The Las Vegas rail line is projected to be 104 percent more intensively used than
London's Underground and only 34 percent less intensively used than the Paris
Metro.
Overall, including both the fixed guideway and bus services, RTC's consultants project
774,000 daily transit boardings in 2020. Indeed, Las Vegas's annual transit boardings
per capita in 2020 would be approximately 125, behind only New York at 145 (1997).(20)
Las Vegas per capita ridership would be more than 50 percent higher than second
ranking Honolulu and nearly 75 percent above third ranking San Francisco. The
increase in transit ridership from current levels would be approximately 400 percent.
Unlike New York, Boston, Philadelphia, Chicago and Washington, Las Vegas residents
do not have a strong proclivity toward transit ridership. Such a tendency relies on
historical factors that do not exist in Las Vegas, such as a dense central city, a dense
and central business district characterized by two directional depth (east-west and
north-south), and high levels of radially oriented transit service operating toward the
central business district without requiring a transfer. These differences between Las
Vegas and other urban areas call into question the reasonableness of the RTC
ridership projections.
Moreover, the factors that differentiate Las Vegas from the more dense US urban cores
are even more evident in the foreign urban areas. Urban areas outside the United
States tend to be more densely populated and have more dominant centrally oriented
travel patterns ("transit friendly" travel patterns). It would therefore be astonishing for
the intensity of fixed guideway ridership in Las Vegas to exceed than that of Madrid,
London or Stockholm or other cities that are dominated by early 20th century or even
late 19th century cores.
Tourist usage in Las Vegas is comparatively substantial, representing approximately
one-third of the Las Vegas Strip bus route (#301). This, however, is not enough to
compensate for the substantial difference between the RTC model projections and the
actual experience in other US and international applications.
The RTC model's rail ridership projections may be the most aggressive ever produced
in the US transit industry and appear to be consistent with the particularly inaccurate
experience with high volume system projections. The RTC rail projection could be as
inaccurate as the highly criticized projections that were the product of consultant
studies in Miami (Section 4). This is of concern, because as little as a 17 percent
reduction in ridership relative to projection to produce a net loss over the period of 2003
to 2034 (in such a case, LLC Monorail revenues would be insufficient to pay operating
expenses and debt service from 2008 to 2027). This tolerance for error is considerably
less than the most accurate high volume passenger projection, at minus 28 percent.
The LLC Monorail is projected to carry 5.00.9 million passengers per route mile in 2004,
which would rank it virtually equal or higher than such high volume rail systems as the
New York subway, the London Underground and the Stockholm Metro. The LLC
Monorail is projected to carry more than twice as many passengers per mile as the
most heavily used new rail systems in the United States (Los Angeles Metro and
Washington Metro). It is not likely that such an intensity of ridership would be attracted.
7. RIDERSHIP RESPONSE TO FARE INCREASES (ELASTICITY)
LLC Monorail plans indicate that passenger fares would be increased 25 cents every
three years. The projections use a fare elasticity assumption that for each 10 percent
increase in fares there will be a 2 percent reduction in ridership (-0.20 price elasticity).
This is barely one-half the public transit industry standard of -3.6 percent for each 10
percent increase in fares (-0.36 price elasticity).(21) for urbanized areas of more than one
million.
The elasticity factor of -0.20 percent could be optimistic. If the actual LLC Monorail
experience reflects the national transit elasticity factor, and all other LLC Monorail
projections are met, ridership would be 12 percent lower. Net cash flow would drop two-thirds (a reduction of approximately $370 million from 2003 to 2035). The overall profit
on operations would fall to 5.9 percent (from 19.3 percent).
Further, the proponent's consultants have applied the fare elasticity factor on an
inflation adjusted basis, which results in higher ridership in fare increase years. Fare
elasticity factors in transit are not applied on an inflation adjusted basis. The result is to
overstate ridership from 2003 to 2035 by approximately seven percent.
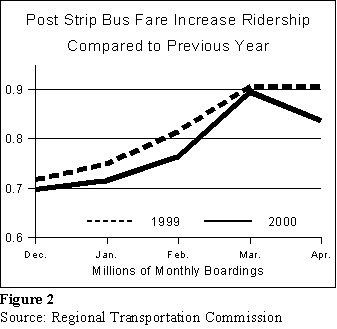
Finally, Las Vegas Strip bus route (#301) ridership has fallen in response to recent fare
increases (the most recent of which was December 1, 1999). Since that time, ridership
has dropped 4.5 percent from the corresponding period in 1998 and 1999, despite the
opening of three of the largest hotels in the world during the intervening period (Figure
#2).(22) In contrast, the report of the state's financial advisor notes that no ridership was
lost as a result of the first of the two fare increases (October 1999).(23) This overly
optimistic view is in direct contradiction to the actual trend in Las Vegas Strip bus
ridership.
8. COMPARISON TO THE LAS VEGAS STRIP BUS ROUTE
Perhaps the most important indicator of the demand for public transit service in the LLC
Monorail service area is ridership on the Citizen's Area Transit Las Vegas Strip bus
route (#301). Route 301 carries approximately 30,000 passengers daily (approximately
10 million annually) and is one of the most successful bus routes in the nation.
Ridership exceeds that of light rail lines in the Portland, Dallas, Sacramento, Los
Angeles, Baltimore, Buffalo, Salt Lake City, San Diego, St. Louis, San Jose, Denver,
New York and metropolitan areas.(24) Approximately one-third of the riders are tourists
(10,000).(25) Route 301 operates over an alignment that is more than double the length of
the LLC Monorail. On a per route mile basis, the LLC Monorail is projected to carry
more than four times the ridership of Route 301.(26)
At the same time, the average fare revenue per passenger on Route 301 is $1.10,
following fare increases that took effect in 1999.(27) The LLC Monorail would charge an
average fare of $2.50, 125 percent higher than the average bus fare.
It is not credible to believe that the market for public transit service in less than one-half
the corridor is nearly double that currently being carried by the successful Route #301
at a fare that would be more than double that of the bus.
The LLC Monorail projects 53,500 daily riders
9. LLC MONORAIL RIDERSHIP ATTRACTED FROM THE BUS
The LLC Monorail is projected to attract only one percent of its ridership from buses,.(28)
or approximately 500 daily riders. The balance of the LLC Monorail ridership is
projected to come from other modes. This means that more than 53,000 daily riders
would be attracted from other modes, such as the existing monorail, taxicabs and
walking. It seems doubtful that there is such a large untapped market for transit service
in the Las Vegas Strip, as is indicated by the following analysis.
10. LLC MONORAIL RIDERSHIP ATTRACTED FROM THE EXISTING MONORAIL
The existing monorail operates from the MGM Grand Hotel to Bally's. Daily ridership is
12,800(29) and no fare is charged. It is projected that one-third of the LLC Monorail
ridership will come from the existing monorail. There are two reasons that this
projection could be unachievable:(30)
One third of the projected LLC Monorail ridership would be nearly 18,000 daily
rides, 5,200 more (41 percent more) than are currently carried on the existing
monorail.(31)
The LLC Monorail would charge an average fare of $2.50, rather than the free
fare operation of the existing monorail. When fares increase, ridership typically
declines. With respect to the longer term LC fare increases planned for the LLC
Monorail, project planners have assumed that each 10 percent increase in fares
will result in a two percent reduction in ridership (-0.20 fare elasticity). In contrast,
national research has found transit's fare elasticity to be -0.36 (above).(32)
Because dividing by zero produces a mathematically undefined result, it is not
possible to calculate the impact of a fare increase from the present level using
fare elasticity factors. Moreover, even if a low fare were charged, such as $0.25,
the resulting fare elasticity calculation would produce a negative ridership figure,
which is an impossible outcome. This reflects the fact that the fare elasticity
factor becomes less accurate as the size of an individual fare increase rises. To
estimate the impact of a fare increase on existing monorail ridership, it was
instead assumed that the $2.50 fare would be reached in a series of rapid fare
increases (for example weekly) that would take the fare from $0.25(33) to $2.00.
Such a strategy is very likely to result in higher ridership than a single fare
increase from zero to $2.50. Such a technique produces, by definition, a smaller
passenger reduction that an immediate fare increased from $0.00 to $2.50,
because the overall fare increase is less. Two estimates were produced (Figure
#3).
The first case assumed the -0.36 national transit fare elasticity factor, with
individual fare increases of 12.5 percent.(34) It is estimated that there factors
would reduce daily ridership from 12,800 to 5,300.
The second case assumed the -0.20 fare elasticity used in the planning of
the LLC Monorail, with individual fare increases of 12.5 percent (the same
percentage as the projected LLC Monorail fare increase in 2007, from
$2.00 to $2.25).(35) It is estimated that there factors would reduce daily
ridership from 12,800 to 7,900.
These calculations would suggest that the existing monorail could contribute, at most,
15 percent of the projected 53,500 daily ridership --- less than one-half the 18,000
projected.
11. LLC MONORAIL RIDERSHIP ATTRACTED FROM WALKING
It is projected that one-third of the LLC Monorail ridership, or nearly 18,000, will be
composed of people who would have otherwise walked.(36) Walking represents the most
popular mode of travel for visitors to the Las Vegas Strip. It is estimated that there will
be approximately 135,000 daily walking trips in the entire Las Vegas Strip in 2003.(37)
In the public transit industry, it is generally accepted that the "catchment" area(38) around
a station is one-quarter mile. For visitors beginning or ending their trips on the west side
of the Las Vegas Strip, the LLC Monorail stations will be at least a quarter of a mile
walk away.
As a result of these long walks to the LLC Monorail stations, visitors beginning or
ending their trips on the west side of the Strip will experience trip times that are little
better than that of the Las Vegas Strip bus (Route #301). These necessary walks will
be made longer in both time and distance by the signalized crossings or pedestrian
bridge crossings of Las Vegas Boulevard South, and the generally circuitous walks
through crowded casinos on the east side of the street. For example:
With respect to trips between the MGM Grand Hotel and the Sahara Hotel (from
one end of the LLC Monorail route to the other):
Visitors with origins or destinations on the west side of the Las Vegas
Strip are likely to find the bus to require five minutes more than the LLC
Monorail, if the other end of the trip is on the east side.
Visitors traveling from origins to destinations on the west side of the Las
Vegas Strip are likely to experience longer travel times.
Visitors with origins and destinations on the east side of the Las Vegas
Strip could save up to 10 minutes by using the LLC Monorail.(39)
With respect to somewhat shorter trips, such as between the MGM Grand Hotel
and Harrah's Imperial Palace Hotel:
the bus is likely to be faster for people beginning or ending their trips on
the west side of the Las Vegas Strip.
Visitors with origins and destinations on the east side of the Las Vegas
Strip could experience travel time savings of up to eight minutes by using
the Monorail.
With respect to trips of one mile or less, visitors on both sides of the Las Vegas
Strip are likely to find that walking time will be competitive with or take less time
than a trip by LLC Monorail, because of the long walks required to reach the LLC
Monorail stations behind the hotels on the east side of the Las Vegas Strip.
Part of the uniqueness of Las Vegas is that walking trips may be undertaken as much
for the experience as to reach a particular destination. The Las Vegas Strip is one of
the most visually stimulating street scapes in the world, which may be why walking is
the most frequent method of travelers for visitors to the Las Vegas Strip. There are
many tourist attractions, ranging from the many world class theme resorts (such as
Bellagio, the Venetian, Paris, Luxor, Treasure Island, etc.) to strip malls that cater to
passers by.
Generally, walkers are divided into three categories:(40)
Approximately 59 percent of such trips take less than 30 minutes, which means
that the LLC Monorail would provide virtually no time advantage, because of the
extra time required to walk to and from the stations.(41)
Approximately 12 percent of walking trips take from 30 to 50 minutes, indicating
distances of slightly more than one to two miles.(42) Either the Las Vegas Strip bus
route or the LLC Monorail would provide some time savings, but both require
paying a fare of $2.00.
Approximately 28 percent of walking trips take more than 50 minutes, which
could provide greater time savings. People walking for this period of time today
could save substantial time by taking the Las Vegas Strip bus route, yet they do
not. For people walking for this long, it is possible that the purpose of the trip
involves not only the destination, but also the visually attractive street scape of
the Las Vegas Strip. It seems unlikely that they would use the LLC Monorail.
There is already a transit alternative to walking along the Las Vegas Strip that makes
possible point to point trips nearly as rapid as the LLC Monorail --- the Las Vegas Strip
bus. Yet, a far larger number of visitors walk than take transit. It seems unlikely that the
LLC Monorail will attract the projected ridership from people who walk along the Las
Vegas Strip.
12. LLC MONORAIL RIDERSHIP ATTRACTED FROM TAXICABS
It is projected that the LLC Monorail will attract approximately 20 percent of its ridership
from taxicabs (11,000 daily riders). There are likely to be approximately 70,000 daily
trips by taxicab in the Las Vegas Strip in 2003,(43) which means that more than 15
percent of taxi passengers would be expected to switch to the LLC Monorail.
The taxicab market is comparatively price insensitive. Taxicab fares between the
locations that will be served by the LLC Monorail range from $4.50 to $10.50,(44)
considerably more than the proposed $2.00 one-way LLC Monorail fare. It is therefore
unlikely that a large number of taxicab passengers will be attracted by the lower fare.
Taxicabs generally pick up and drop off passengers closer to their destinations (such as
at the front door of hotels). Finally, taxicabs are not restricted to heavily congested Las
Vegas Boulevard South, and can use less congested roadways, such as Paradise
Road and Industrial Boulevard. It is unlikely, therefore, that destination to destination,
the LLC Monorail will provide a material time savings for taxicab passengers.
Finally, the Las Vegas taxicab market, like other markets, is dynamic, not static. The
principle is illustrated by the English Channel ferry companies, which responded
effectively to the new competition provided by the tourist oriented high speed rail and
rail shuttle services operated through the new channel tunnel (Eurotunnel). The result
has been patronage well below projection and far worse than projected financial
performance. It likely that the Las Vegas taxicab will similarly respond to any serious
competitive threat posed by the LLC Monorail.
The percentage of ridership anticipated to be attracted from taxicabs therefore appears
to be optimistic.
13. COMPARISON TO OTHER LOCAL CIRCULATORS
The ridership projections are so high that LLC Monorail would be by far the most
productive local circulator system in the nation.
Ridership would be more than 3.5 times that of the second ranking system, the
Miami Metromover (which, unlike the LLC Monorail, has the ridership attraction
advantage of being integrated with a regional rail system). It would be five times
that of the Seattle Monorail, which has the highest ridership of systems not
integrated with a regional system. The LLC Monorail would have ridership
intensity 30 times that of the similar technology Jacksonville monorail.,
The LLC Monorail would have by far the highest average fare per passenger,
more than four times that of the Seattle Monorail.
Each of the other local circulation systems operates with average passenger fares that
are less than one-third that projected for the LLC Monorail. Miami's Metromover, which
has the highest ridership of any operating local circulation system, charges an average
fare barely 1/15th that of the LLC Monorail. The LLC Monorail's fare and projected
ridership are well outside the range of current experience (Figure #4 and Table #2).
|
Table #2
Local Circulation Systems: Ridership and Fares |
| Local Circulator |
Daily
Ridership |
Average Fare |
| Las Vegas Monorail |
53,500 |
$2.50 |
| Miami Metromover |
13,400 |
$0.14 |
| Seattle Monorail |
9,000 |
$0.63 |
| Detroit People Mover |
7,000 |
$0.46 |
| Jacksonville Monorail |
1,800 |
Less than $0.35 |
| Sources: Calculated or estimated from LLC Monorail, Metro Dade Transit,
National Transit Database and Jacksonville Transportation Authority
information.
|
14. FARE RECOVERY RATIO
As a result of its high fare and projected high ridership, the LLC Monorail is would have
a fare recovery ratio of 280 percent(45) (fare revenues divided by operating expenses,
excluding debt service and taxes), 2.8 times that of the Seattle Monorail and more than
20 times that of the systems in Miami, Detroit and Jacksonville (Figure #5).
It is projected that the LLC Monorail will collect more than $40 million in fare revenues
in its first full year of operation (2004).(46) This is more fare revenue (inflation adjusted)
than is collected by the entire RTC transit system and by metropolitan transit systems
operating both bus and rail systems in Dallas and St. Louis. The projected 274 percent
fare recovery ratio would be nearly nine times that of the average US transit system, at
32 percent.(47) The LLC Monorail fare recovery ratio is projected to be approximately four
times that of the intensively patronized New York City Transit Authority, which accounts
for more than one-quarter of all US transit ridership (Table A-3, Appendix).
In addition to its unprecedentedly high fare recovery ratio, the LLC Monorail would have
a higher average passenger fare than any metropolitan transit system in the nation(48)
and by far the highest fare per passenger mile. The $2.50 LLC Monorail average fare
is nearly 2.3 times the average fare paid on the Las Vegas Strip bus route (#301),
which averaged $1.10 in early 2000.(49) This is after implementation of fare increases in
late 1999.
15. HOTEL GENERATION MODEL
The Ridership and Revenue Study notes that there is a correlation between hotel
rooms and existing monorail ridership. The existing monorail has stations at two hotels,
which have a combined total of 7,800 hotel rooms. The LLC Monorail will have seven
stations and will directly serve major eight hotels and two smaller hotel properties,
which will have a combined total of approximately 25,000 rooms in 2003.(50) Based upon
present monorail ridership, the ratio of present hotel rooms to the future 25,000 hotel
room figure yields daily ridership of approximately 41.200. This estimate, however, is
based upon no fare being charged. The imposition of a $2.50 fare is likely to reduce the
potential ridership.
At the LLC Monorail projected -0.20 fare elasticity assumption, with individual
fare increases of 12.5 percent (as in Section 10),(51) ridership would be 39.0
percent lower in 2004.
At the national -0.36 fare elasticity assumption, with individual fare increases of
12.5 percent (as in Section 10),(52) ridership would be 59.3 percent lower in 2004.
16. ADVERTISING REVENUES
In its first full year of operation (2004), the LLC Monorail is projected to earn $6.7 million
in advertising revenues. This is a very high figure for a system operating 36 or fewer rail
cars. By comparison:(53)
The Washington, DC transit system, operating more than 600 rail cars and 1,100
buses earns less than $4 million in advertising revenues.(54)
Transit systems in metropolitan areas of similar size to Las Vegas (San Antonio,
Austin and Indianapolis) earn less than $600,000 in annual advertising revenues.
(55)
The eventual advertising revenue could be significantly lower than projected, which
would have a negative effect on the project's finances.
If advertising revenue were to fall 50 percent short of forecast, net income would
drop nearly 50 percent (a reduction of $170 million from 2003 to 2034). The
overall profit on operations would fall to 7.8 percent (from 15.2 percent).
If advertising revenue were to fall 90 percent short of forecast, net income would
drop more than 90 percent (a reduction of $300 million from 2003 to 2034). The
overall profit on operations would fall to 1.8 percent (from 15.2 percent).(56)
17. OPERATING AND CAPITAL COSTS
US fixed guideway projects have often cost more to build and operate than projected.
During the 1980s, federally financed urban rail projects cost 46 percent more to build,
and 78 percent more to operate than projected.(57) As in the over-projection of ridership,
this is representative of the international experience. The National Academy of
Sciences report found that both operating costs and capital costs are typically
underestimated in large transportation projects.(58)
... cost overruns of 50 to 100 percent are common and ... overruns of more than
100 percent are not uncommon.
This problem has afflicted both projects developed by the public sector and the private
sector. A classic example was the privately developed Eurotunnel:
The English Channel Eurotunnel was to have been built for $7.8 billion. Costs
escalated to $18.6 billion --- an increase of nearly 140 percent (not including the
higher cost of interest due to larger borrowing requirements than projected).(59)
After opening a year late, its first year of operation produced a loss of $1.5
billion. The competitive response of cross-channel ferry operators reduced tunnel
traffic to below expectations. After failing to pay interest on its debt for more than
a year, a financial bail-out was negotiated with creditors.
In the United States, local circulator projects similar to the LLC Monorail have had
similar cost projection difficulties.
Miami's Metromover cost 106 percent more to build and 84 percent more to
operate than projected.(60)
Detroit's downtown people mover cost 81 percent more to build and 356 percent
more to operate than projected.(61)
The LLC Monorail ridership projections, which seem exceedingly optimistic, lead to a
concern that the operating and capital cost projections may be similarly optimistic. For
example, a 25 percent operating cost overrun could reduce project net profits by nearly
$200 million over the period of 2003 to 2034.
It is intended that the builders (Bombardier Transit Corporation(62) and Granite
Construction Company) will guarantee completion of the LLC Monorail within the
projected capital cost. Such guarantees, however, may not cover unforseen
circumstances that are not within the control of the builders.
18. ADDITIONAL ISSUES
There are additional issues with respect to the LLC Monorail project:
Potential Delay to Comply with Federal Environmental Regulations: In a
recent action, the Regional Transportation Commission approved the concept of
developing its proposed 18 mile fixed guideway project in conjunction with the
Las Vegas Monorail.(63) The result would be a "seamless " route that would
operate at least from Cashman Field to the MGM Hotel. Pursuant to federal law
and regulation, any federally funded fixed guideway project must be subjected to
a federal Environmental Impact Statement. Because the LLC Monorail could
become integrated with a federally financed project, it may also be subject to the
federal Environmental Impact Statement process. There are at least a few
potential bases for litigation on this issue. Any serious legal challenge could
delay the project not only for litigation, but also for the Environmental Impact
Statement process, which could take two years or more.
Potential Competition from a Continuous West Strip Monorail: The
projections presume that the LLC Monorail would be attractive to guests staying
at hotels on the west side of the Las Vegas Strip. There are already three
monorails on the west side of the Las Vegas Strip, and more continuous
monorails (or a single continuous monorail) were developed it could divert
ridership from the LLC Monorail.
19. REVISED RIDERSHIP AND REVENUE PROJECTIONS
Based upon the analysis above, two revised ridership and revenue projections were
developed and compared to the projections produced for the LLC Monorail
Projection #1: Proponent's Projection, is as supplied by the LLC Monorail project
sponsors (Table A-4, Appendix).(64)
Projection #2: Optimistic Ridership: This case accepts all LC assumptions (including
what appears to be a very optimistic advertising revenue level),(65) but adjusts to account
for the $2.50 fare using the LLC Monorail elasticity factor of -0.20 (Table A-5,
Appendix). The High Ridership Projection is based upon the following calculations:(66)
Based upon the number of hotel rooms along the route, ridership at a $0.00 fare
would be 23.9 percent below the 53,500 projected by the project consultants.
To account for the $2.50 fare, there is a downward ridership adjustment of 39.0
percent, using the LLC Monorail elasticity factor of -0.20. Consistent with the
conventional approach, the elasticity factor is not adjusted for inflation.
The LLC Monorail elasticity factor of -0.20 would apply to fare increases between
2003 and 2035.
The Optimistic Ridership Projection yields the following results (Table #3 and Table #A-6 in the Appendix):
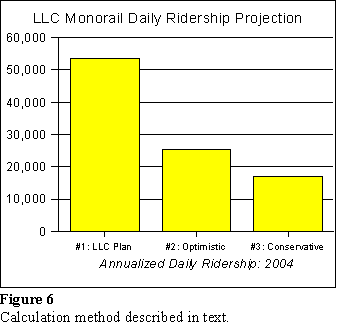
Average daily ridership in 2004 would be 25,400 instead of the projected 53,500
(Figure #6). By 2035, daily ridership would rise to 26,800 compared to the LLC
Monorail projection of 64,500.
Even so, ridership would be very substantial. At 2.345 million annual rides per
route mile in 2004, the LLC Monorail would carry more passengers per route
mile than the most heavily patronized new subway systems in the nation (Los
Angeles Metro and Washington Metro).
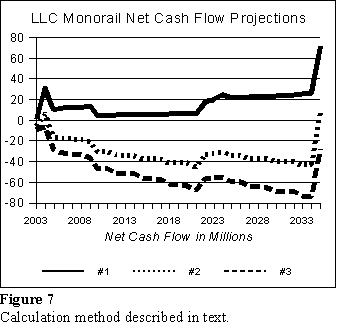
Over the period of 2003 to 2035, a negative financial result of $1.53 billion would
be produced, with an $1.00 billion net cash flow loss instead of the $534 million
positive net cash flow (Figure #7). The net negative cash flow would be 36
percent. The fare recovery ratio, however, would be the highest in the nation, at
123 percent.
The LLC Monorail would produce revenues that are less than its annual
obligations in every year from 2005 through 2034. Project revenues would be
insufficient to pay project financial obligations 31 of 33 years, with net positive
revenues only in 2004 and 2035.
From 2007, debt service reserves and the general fund would be insufficient to
pay ongoing project obligations.
Projection #3: Conservative Ridership: This projection is considered to be the more
likely scenario, and is based upon the following assumptions.
Based upon the number of hotel rooms along the route, ridership at a $0.00 fare
would be 23.9 percent below the 53,500 projected by the project consultants.
To account for the $2.50 fare, there is a downward ridership adjustment of 59.3
percent, using the national fare elasticity factor of -0.36.
The national elasticity factor of -0.36 would apply to fare increases between
2003 and 2034. Consistent with the conventional approach, the elasticity factor
is not adjusted for inflation.
Advertising revenues would be 50 percent below projection.
Operating costs would be 10 percent higher than projection.
The Conservative Ridership Projection yields the following results (Table #3 and Table
#A-6 in the Appendix):
Average daily ridership in the first year of operation would be 16,900 instead of
the projected 53,500 (Figure #6). By 2035, daily ridership would fall to 15,900,
compared to the LLC Monorail projection of 64,500.
Yet ridership would be substantial. At 1.565 million annual rides per route mile in
2004, the LLC Monorail would more than double the passengers per route mile
of the most heavily used new light rail systems (San Diego, St. Louis and Los
Angeles).
A negative financial result of $2.2 billion would result over the period of 2003
through 2035, with a net negative cash flow of more than $1.71 billion (net
negative cash flow of -59.9 percent), compared to the projected net income of
$534 million (Figure #7).
The LLC Monorail would still achieve one of the highest urban transit fare
recovery ratios in the nation, at 70 percent, higher than that of the nation's most
intensively patronized public transit system, the New York City Transit Authority..
Project revenues would be insufficient pay obligations in all years of the planning
horizon (2003 through 2035).
From 2006, debt service reserves and the general fund would be insufficient to
pay ongoing project obligations.
| Table #3
Summary of Projections |
|
Projection #1
Proponents
(as supplied
by LLC
Monorail) |
This Study |
| Projection #2
Optimistic
Ridership |
Projection #3
Conservative
Ridership |
| Daily Ridership: 2004 |
53,525 |
25,363 |
16,924 |
| Comparison to #1 |
-- |
-52.6% |
-68.4% |
| Daily Ridership: 2035 |
64,482 |
26,751 |
15,872 |
| Comparison to #1 |
-- |
-59.5% |
-75.4% |
| Planned Net Cash Flow: 2003-2035 (Millions) |
$534 |
$534 |
$534 |
| This Case Net Cash Flow: 2003-2035 (Millions) |
$534 |
($1,000) |
($1,705) |
| Variation: 2003-2035 (Millions) |
$0 |
($1,533) |
($2,239) |
| Fare Recovery Ratio: 2003-2035 |
280.0% |
122.7% |
70.6% |
| Revenues/Expenses: 2003-2035 |
19.3% |
-36.0% |
-59.9% |
| Years Financial Obligations Met by Cash Flow |
33 of 33 |
2 of 33 |
0 of 33 |
| First Year Financial Obligations Not Met by Cash Flow |
NA |
2004 |
2003 |
| Year Negative Result Exceeds Reserves & Funds |
NA |
2007 |
2006 |
Nonetheless, even the Conservative Ridership Projection (#3) is considered optimistic,
for the following reasons.
The negative impact upon ridership of the high fare cannot be reliably estimated
by the national fare elasticity formula. The "multiple fare increase" assumption,
which was used to estimate the short term impact of an increase from $0.25 to
$2.50 (Section 10), by definition, produces a more favorable result that a single
fare increase from $0.00 to $2.50.
Advertising revenues could be considerably lower.
Ridership projections for other local circulators have been particularly unreliable.
Ridership projections for high volume systems such as the LLC Monorail have
been exceedingly unreliable.
It is not inconceivable that ridership (and revenue) could fall 75 percent or more short of
projection, as has occurred in the cases of the three local circulators (Miami, Detroit and
Jacksonville) built since 1980.
The LLC Monorail could not survive even the smallest ridership projection error that has
been typical of high volume fixed guideway projects. If project revenue (fares and
advertising) is as little as 11 percent short, the LLC Monorail would be incapable of
meeting its financial obligations, even if all other project projections and assumptions
proved accurate. Virtually no ridership projection for a high volume fixed
guideway project has been accurate enough that if achieved in Las Vegas would
enable the LLC Monorail to meet its financial obligations. Ridership projections for
high volume fixed guideways have had an average error of 72 percent, and the most
accurate has been an error of 28 percent (Section 4).
From the information available, there is likely to be a considerable risk that the LLC
Monorail will be unable to meet its ridership projections, revenue projections or financial
obligations.
20. IMPACT ON RIDERS AND TAXPAYERS
The LLC Monorail could pose risks for state taxpayers, local taxpayers and transit
riders:
The Las Vegas Strip bus route is intensively patronized by both residents and
tourists. Its fare is higher than that of other RTC bus routes and it appears likely
that the revenues on this route are substantially higher than the operating cost.
This means that Route #301 is providing financial support to the other RTC
routes ("cross-subsidizing"), all of which are likely to be earning an operating
loss. The financial impact of the LLC Monorail on this important subsidy source
is, as a result, an important consideration.
The anticipated diversion of ridership from the Las Vegas Strip bus route would
have little if any impact upon the financial viability of the RTC bus system (one
percent of LLC Monorail ridership or less than two percent of bus ridership would
be attracted away from the bus route).
There is the potential, however small, that the Monorail could divert more of its
passengers from the bus than projected. These riders would undoubtedly be
tourists who pay the full $2.50 fare, as opposed to local residents who are able
to take advantage of senior citizens discounts and discounted passes. While
tourists represent only one-third of Route #301 ridership, their fares represent up
to 80 percent of route revenues.(67) As a result, if a significant number of tourists
were to choose the LLC Monorail instead of the bus, RTC could face a large,
unplanned financial deficit. This could make it necessary to seek other subsidy
sources to support the regional transit system, such as higher taxes.(68)
It is intended that the LLC Monorail will be operated cooperatively with a to be
developed RTC fixed guideway from the north terminal to Cashman Field
(Section 18). A financial failure on the part of the LLC Monorail could contribute
to circumstances under which higher taxes might be sought to continue
operation of the LLC Monorail, as a part of the RTC system.
3. In the event of a financial failure, the state could face higher bond interest rates,
which would raise the cost of debt to state taxpayers.
21. ISSUES RAISED BY THE APRIL 2000 PROJECTIONS
Since publication of the original Wendell Cox Consultancy report in January 2000, LLC
Monorail proponents have submitted a new set of financial and ridership projections.
This 2d Edition is includes revisions based upon analysis of these new projections.
Significant changes in projections: Some of the proponents projections represent
significant changes in comparison with those originally submitted to the state of Nevada
Department of Business and Industry in late 1999. A number of the changes are very
significant:(69)
The purchase price of the existing monorail, which will be partially or completely
demolished, has risen from $20 million to $25 million, which would be paid to the
present owners (MGM Grand and Bally's). There is no requirement for an
independent assessment of this asset for sale.
The fee to be paid to the LC management company (Las Vegas Monorail
Management Co.) for system administration and oversight has risen 250 percent
(2003 to 2035), from $79 million to $276 million (Figure #8).
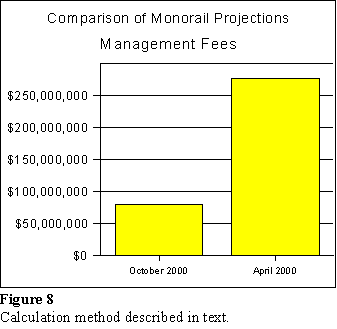
Operating expenses have risen 44 percent, from $754 million to $1.094 billion.
Net cash flow has risen 54 percent (approximately $188 million).
The starting average fare rose from $2.00 to $2.50. Over the project horizon,
average fares would rise to $5.00, 33 percent higher than the highest fare that
was projected in the previous documentation ($3.75).
Fare increases of $0.25, which were to occur every four years, will now occur
every three years.
The net effect of the higher average fare and accelerated fare increases is
projected to increase fare revenues from $2.080 to $2.733 billion from 2003 to
2035. This is a $653 million increase in fare revenues (31 percent).
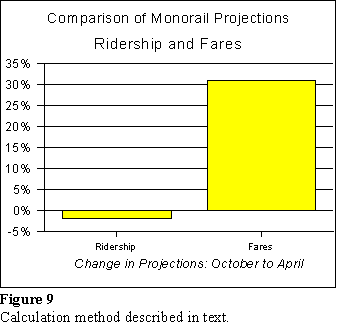
The ridership and fare revenue projections of proponent's consultants would seem to
reinforce the conclusion that the state of transit ridership modeling is unreliable for
application to commercial projects.
Despite the 25 percent increase in starting average fares, comparatively little
impact on ridership is projected. Proponent's previous projections were for
20,177,000 million annual riders in 2004 with the $2.00 average fare. The new
projections indicate that 19,536,000 annual riders will be carried, with a $2.50
average fare. This is a 3.3 percent reduction. A change in the fare structure of 25
percent should have resulted in a five percent loss of ridership using the
proponent's fare elasticity factor of -0.2, or nine percent using the -0.36 industry
standard.
More incredulously, 2034(70) ridership, with a $5.00 average fare, is projected at
only 0.7 percent below the previous projection, which assumed a $3.75 fare.
Such a difference should have resulted in a reduction of 6.6 percent to 11.9
percent.
From 2004 to 2034, fare revenues increase 31 percent in the new projections,
while ridership drops only two percent (Figure #9).
The cost increases are considered highly questionable and the revenue increase is
considered unachievable. Each of these changes from projections supplied in 1999
would appear to make the project less viable financially.
Administrative Costs: The new higher level of administrative costs to be paid to the
management company is substantially higher than that of the nation's rail transit
operators. Administrative costs will be approximately 28 percent of total operating costs
(excluding capital costs and taxes) from 2003 to 2035. On average, the nation's subway
and light rail systems spend approximately 17 percent on administration.(71) It would be
expected that the LLC Monorail administrative burden would be lower, because many a
number of transit administrative functions will not be present because they are included
in the operations contract or not required.
The LLC Monorail's 65 percent higher administrative load is at least partially due to
what appear to be exorbitant management salaries. The Business Plan of the Las
Vegas Monorail Management Company proposes a first year expenditure of
$2,097,000 in salaries and benefits for a staff of four managers and four clerical
employees. Assuming that the clerical employees are paid at the Clark County average
salary and benefit level (approximately $40,000 annually), the four managers of the Las
Vegas Monorail Management Company would be paid an average of $485,000
annually.
Inconsistent projections: The very significant revisions that have occurred in the
projections between the original submittals to the state and the latest are cause for
concern. In a period of just six months, the starting fare has been increased by 25
percent, the sale price of the existing monorail has risen 25 percent, and the
management fee has risen 250 percent. It is inconceivable that any circumstances have
changed during this short period of time that would require adjustments of such
significance. These inconsistencies could cast doubt on the seriousness and
reliableness of the analysis that produced the projections.
Appendices
| Table #A-1
US Rail Systems: Annual Boardings per Route Mile |
| Rail System |
Type |
Annual
Boardings
per Route
Mile
(000,000) |
If New |
Las Vegas
Rail
Ridership
Intensity in
Comparison |
| 1 |
Las Vegas-RTC: 2020 Projection |
Heavy rail |
6.164 |
|
0.0% |
| 2 |
NY-MTA-NYCTA |
Heavy rail |
5.010 |
|
23.1% |
| 3 |
Port Authority-PATH |
Heavy rail |
4.527 |
|
36.2% |
| 4 |
Boston-MBTA |
Heavy rail |
2.994 |
|
105.9% |
| 5 |
Boston-MBTA |
Light rail |
2.559 |
|
140.9% |
| 6 |
Philadelphia-SEPTA |
Heavy rail |
2.276 |
|
170.8% |
| 7 |
Washington-WMATA |
Heavy rail |
2.226 |
New |
176.9% |
| 8 |
LA-LACMTA-Metro |
Heavy rail |
1.963 |
New |
214.1% |
| 9 |
Atlanta-MARTA |
Heavy rail |
1.741 |
New |
254.0% |
| 10 |
San Francisco-Muni |
Light rail |
1.499 |
|
311.3% |
| 11 |
Chicago-RTA-CTA |
Heavy rail |
1.304 |
|
372.6% |
| 12 |
Buffalo-NFTA |
Light rail |
1.226 |
New |
403.0% |
| 13 |
Philadelphia-SEPTA |
Light rail |
1.099 |
|
461.1% |
| 14 |
San Francisco-BART |
Heavy rail |
1.075 |
|
473.4% |
| 15 |
New Jersey Transit |
Light rail |
0.948 |
|
550.5% |
| 16 |
New Orleans-RTA |
Light rail |
0.884 |
|
597.6% |
| 17 |
Denver-RTD |
Light rail |
0.765 |
New |
705.8% |
| 18 |
San Diego- The Trolley |
Light rail |
0.753 |
New |
718.7% |
| 19 |
St. Louis-Bi-State |
Light rail |
0.735 |
New |
739.1% |
| 20 |
Baltimore-Maryland-MTA |
Heavy rail |
0.718 |
New |
758.4% |
| 21 |
Philadelphia-PATCO |
Heavy rail |
0.691 |
|
792.3% |
| 22 |
Miami-MDTA |
Heavy rail |
0.673 |
New |
815.7% |
| 23 |
LA-LACMTA-Metro (Note) |
Light rail |
0.557 |
New |
1007.1% |
| 24 |
Portland-Tri-Met |
Light rail |
0.515 |
New |
1096.5% |
| 25 |
Pittsburgh-PAT |
Light rail |
0.420 |
|
1368.6% |
| 26 |
Sacramento-RT |
Light rail |
0.390 |
New |
1479.6% |
| 27 |
Cleveland-RTA |
Heavy rail |
0.364 |
|
1594.2% |
| 28 |
NY-MTA-Staten Island |
Heavy rail |
0.355 |
|
1638.8% |
| 29 |
Cleveland-RTA |
Light rail |
0.333 |
|
1751.4% |
| 30 |
San Jose-SCCTD |
Light rail |
0.290 |
New |
2024.0% |
| 31 |
Baltimore-Maryland-MTA |
Light rail |
0.267 |
New |
2212.3% |
| Source: Calculated from National Transit Database, 1995 |
| Table #A-2
Rail Systems in High Auto Use Nations:
Rail Ridership: Annual Boardings per Route Mile |
| Urban Area |
Nation |
Annual
Boardings per
Route Mile
(000,000) |
Las Vegas
Rail Ridership
Intensity in
Comparison |
| 1 |
Vienna |
Austria |
11.437 |
-46.1% |
| 2 |
Paris |
France |
9.365 |
-34.2% |
| 3 |
Rome |
Italy |
9.052 |
-31.9% |
| 4 |
Milan |
Italy |
8.093 |
-23.8% |
| 5 |
Las Vegas-RTC: 2020 Projection |
US |
6.164 |
0.0% |
| 5 |
Munich |
Germany |
6.164 |
0.0% |
| 7 |
Lyon |
France |
6.110 |
0.9% |
| 8 |
Nuremberg |
Germany |
5.908 |
4.3% |
| 9 |
Madrid |
Spain |
5.546 |
11.1% |
| 10 |
Barcelona |
Spain |
5.398 |
14.2% |
| 11 |
Berlin |
Germany |
5.111 |
20.6% |
| 12 |
NY-MTA-NYCTA |
US |
5.010 |
23.1% |
| 13 |
Marseille |
France |
4.640 |
32.8% |
| 14 |
Port Authority-PATH |
US |
4.527 |
36.2% |
| 14 |
Toulouse |
France |
3.613 |
70.6% |
| 16 |
Stockholm |
Sweden |
3.578 |
72.3% |
| 17 |
Helsinki |
Finland |
3.541 |
74.1% |
| 18 |
Lille |
France |
3.038 |
102.9% |
| 19 |
London |
UK |
3.020 |
104.1% |
| 20 |
Boston-MBTA |
US |
2.994 |
105.9% |
| Source: Calculated from National Transit Database, 1995 and Janes Urban Transport, 1996-7. |
|
Table #A-3
Fare Recovery Ratios: Major US Transit Systems |
| Rank |
State |
Transit System |
Fare
Recovery
Ratio |
| 1 |
NV |
Las Vegas Monorail |
280.0% |
| 2 |
WA |
Seattle-Monorail |
100.0% |
| 3 |
NY |
NY-MTA-NYCTA |
68.7% |
| 4 |
NY |
NY-Westchester-Liberty |
67.6% |
| 5 |
CA |
San Diego- The Trolley |
67.5% |
| 6 |
NY |
NY-MTA-Metro North RR |
62.2% |
| 7 |
CA |
San Francisco-BART |
55.8% |
| 8 |
NJ |
Philadelphia-PATCO |
55.4% |
| 9 |
NY |
NY-MTA-Long Island RR |
54.7% |
| 10 |
DC |
Washington-WMATA |
51.2% |
| 11 |
IL |
Chicago-RTA-Metra |
49.8% |
| 12 |
NJ |
New Jersey Transit |
47.1% |
| 13 |
CA |
San Diego-SANDAG |
46.5% |
| 14 |
NY |
Port Authority-PATH |
46.4% |
| 15 |
NV |
Las Vegas - ATC\VanCom |
44.8% |
| 16 |
IL |
Chicago-RTA-CTA |
44.2% |
| 17 |
NY |
NY-MTA-Long Island Bus |
42.6% |
| 18 |
CA |
San Diego Transit |
41.8% |
| 19 |
NY |
Rochester-RTS |
41.0% |
| 20 |
PA |
Philadelphia-SEPTA |
40.4% |
| 21 |
WI |
Milwaukee-County |
40.3% |
| 22 |
MN |
Minneapolis-St. Paul-MCTO |
39.5% |
| 23 |
LA |
New Orleans-RTA |
39.3% |
| 24 |
FL |
Orlando-LYNX |
39.2% |
| 25 |
CA |
LA-Foothill Transit |
38.6% |
| 26 |
MD |
Baltimore-Maryland-MTA |
37.7% |
| 27 |
MA |
Boston-MBTA |
37.4% |
| 28 |
VA |
Norfolk-TRT |
35.4% |
| 29 |
NY |
Albany-CDTA |
35.0% |
| 30 |
GA |
Atlanta-MARTA |
34.9% |
| 31 |
CA |
San Francisco-Muni |
34.7% |
| 32 |
NY |
Buffalo-NFTA |
34.3% |
| 33 |
CA |
SF-Golden Gate |
31.2% |
| 34 |
OH |
Cincinnati-SORTA |
31.1% |
| 35 |
AZ |
Phoenix PTD |
30.5% |
| 36 |
FL |
Miami-MDTA |
29.8% |
| 37 |
CA |
LA-LACMTA-Metro |
29.8% |
| 38 |
IL |
Chicago-RTA-Pace |
28.7% |
| 39 |
CA |
LA-OCTA |
28.1% |
| 40 |
HI |
Honolulu-DTS |
27.9% |
| 41 |
PA |
Pittsburgh-PAT |
27.0% |
| 42 |
CA |
Sacramento-RT |
26.2% |
| 43 |
CA |
SF-SamTrans |
26.1% |
| 44 |
RI |
Providence-RIPTA |
25.9% |
| 45 |
CA |
Oakland-AC Transit |
24.8% |
| 46 |
OH |
Columbus-COTA |
24.8% |
| 47 |
FL |
Ft. Lauderdale-Bct |
24.6% |
| 48 |
WI |
Madison-MMT |
24.5% |
| 49 |
OR |
Portland-Tri-Met |
24.0% |
| 50 |
FL |
Tampa-Hartline |
23.8% |
| 51 |
OH |
Cleveland-RTA |
23.3% |
| 52 |
MO |
St. Louis-Bi-State |
22.7% |
| 53 |
WA |
Seattle-Metro |
22.3% |
| 54 |
AZ |
Tucson-Sun Tran |
22.3% |
| 55 |
MD |
Maryland-Ride-On |
21.9% |
| 56 |
TX |
Houston-Metro |
21.7% |
| 57 |
CO |
Denver-RTD |
21.6% |
| 58 |
DE |
Delaware-DTC |
20.9% |
| 59 |
MI |
Detroit-D-DOT |
20.9% |
| 60 |
UT |
Salt Lake City-UTA |
19.0% |
| 61 |
MO |
Kansas City-KCATA |
19.0% |
| 62 |
KY |
Louisville-TARC |
18.4% |
| 63 |
WA |
Seattle-Snohomish-Commun. |
17.7% |
| 64 |
TX |
Fort Worth-The T |
17.5% |
| 65 |
WA |
Tacoma-Pierce Transit |
17.2% |
| 66 |
WI |
Milwaukee-Paratransit |
17.0% |
| 67 |
OH |
Dayton-RTA |
16.5% |
| 68 |
CA |
City of Los Angeles |
16.5% |
| 69 |
MI |
Detroit-SMART |
15.9% |
| 70 |
OH |
Akron-Metro |
15.1% |
| 71 |
CA |
San Jose-SCCTD |
14.7% |
| 72 |
WA |
Spokane-STA |
14.1% |
| 73 |
TX |
Dallas-DART |
14.0% |
| 74 |
TX |
San Antonio-VIA |
11.7% |
| 75 |
WA |
Bremerton-Kitsap Transit |
10.8% |
| 76 |
TX |
Austin-Capital Metro |
10.7% |
| 77 |
WA |
Richland-Ben Franklin |
10.4% |
| 78 |
CA |
LA-Access |
5.8% |
|
|
Average (Excludes Las Vegas Monorail) |
31.7% |
| Las Vegas data projected for 2003-2035 (Proponents Projection, #1)
Other data from 1997 National Transit Database |
1. There are reports that the existing Monorail's ridership has risen since the opening
of the Paris Hotel-Casino complex. This does not change the fact that, based upon
a ridership level nearly one-third below the 18,000 that were projected to switch
from the existing monorail, only 12,800 were riding it, and at no fare. The issue is
one of appropriate professional methods.
2. Two dimensional refers to dense commercial development that occurs both east to
west and north to south. The Las Vegas Strip development is largely one-dimensional, south to north.
3. Public transit method for calculating fare revenue ratio.
4. Fixed guideways include conventional rail systems, such as light rail and
subways, automated people movers, and monorails and any technology in which
transit vehicles operate and are controlled on a fixed facility (track).
5. 20,642 feet.
6. Salomon Smith Barney, The Las Vegas Monorail: Preliminary Overview, October
1999.
7. Available cost projections use a lower ridership figure for 2003, on the
assumption that the LLC Monorail would begin operation after the start of the
year. For the purposes of evaluating initial ridership, this study presumes that the
system would operate through the entire year of 2003, consistent with the
projections in the Ridership and Revenue Study. The financial analysis, however,
is based upon the projections as included in the Draft Analysis Base Case
(October 3, 1999, 3:22 p.m.).
8. URS Greiner Woodward Clyde, Forecasts of Ridership and Revenue for the
Proposed Seven-Station Las Vegas Monorail System, April 2000, October 1999
and August 1999 (drafts). Hereinafter referred to as Ridership and Revenue Study.
9. Two dimensional refers to dense commercial development that occurs both east to
west and north to south. The Las Vegas Strip development is largely one-dimensional, south to north.
10. Don Pickrell, Urban Rail l Transit Projects: Forecast Versus Actual Ridership
and Costs (Washington, DC: Urban Mass Transportation Administration, US
Department of Transportation, October 1989).
11. Metro-Dade Transit
12. Data from National Transit Database.
13. Ridership is now considerably lower, due to an unrelated building collapse that
temporarily closed part of the system.
14. Mette K. Skamris and Bent Flyvbjerg, "Accuracy of Traffic Forecasts and Cost
Estimates on Large Transportation Projects," Transportation Research Record
(Washington, DC: Transportation Research Board, National Research Council),
1996.
15. Calculated from National Transit Database data. A route mile is a mile of two way
route (for example, if the ends of a route are 10 miles apart, there would be 10
route miles).
16. Pickerel.
17. Los Angeles Metro Green Line Norwalk-El Segundo, Los Angeles County
Transportation Commission, 1989.
18. Bus and Rail Performance Report, Los Angeles County Metropolitan
Transportation Authority, 1997.
19. The line is reported to be carrying 3,700 daily riders compared to the first year
projection of 18,200.
20. Based upon Las Vegas metropolitan population projection of 2.114 million in
2020. This is derived by applying the RTC projected rate of population growth
within the RTC transit service area to the metropolitan area.
21. For urbanized areas of more than one million population. The industry standard
for all areas, small and large, is -0.40. Source: American Public Transit
Association.
22. Venetian, Mandalay Bay and Paris.
23. Public Resources Advisory Group, Draft Report: Review of the Las Vegas
Monorail Project: Presented to the State of Nevada Department of Business &
Industry, May 26, 2000.
24. Downtown oriented corridors.
25. RTC Hotel Visitor Intercept Survey, May 1996.
26. In 2003, the LLC Monorail is projected to carry approximately 5.1 million riders
per route mile. Route #301 carries approximately 1.3 million riders per mile.
27. The average fare is substantially lower than the $2.00 single ride fare because of
the use of discounted passes and lower fares for local senior citizens. In 1998 the
average fare was $0.84.
28. Carter Burgess memorandum to John Toth, Clark County Traffic Management
Division, item #4 (September 10, 1999).
29. Ridership and Revenue Study.
30. There are reports that the existing Monorail's ridership has risen since the opening
of the Paris Hotel-Casino complex. This does not change the fact that, based upon
a ridership level nearly one-third below the 18,000 that were projected to switch
from the existing monorail, only 12,800 were riding it, and at no fare. The issue is
one of appropriate professional methods.
31. This factor illustrates a serious concern with respect to the ridership projections. It
is clear that charging a $2.00 fare instead of no fare would reduce ridership. Yet
the projection is that more people would be diverted from the existing no-fare
monorail than currently ride. This could indicate that the ridership projections
have not taken sufficient account of the impact of higher fares. This theme is
developed later in the report.
32. Data for urbanized areas of more than one million population, American Public
Transit Association.
33. To make calculations possible, it is assumed that the present fare is $0.25, instead
of the actual $0.00.
34. The final fare increase would be less, so that the $2.50 fare is reached. Fare
increases of this magnitude are considered within the range of reliability with
respect to the fare increase elasticity factor.
35. The final fare increase would be less, so that the $2.00 fare is reached.
36. Carter Burgess memorandum to John Toth, Clark County Traffic Management
Division, item #4 (September 10, 1999).
37. Based upon the 1996 RTC estimate of 119,000 and increased by two percent
annually to 2003.
38. Maximum distance that most people are willing to walk to a transit stop.
39. Assumes 15 minutes walking time from west side hotels to LLC Monorail
stations, five minute walking time from hotels to the Las Vegas Strip bus, waiting
time of five minutes for the bus, and two minutes for the LLC Monorail. The Las
Vegas Strip bus is assumed to operate at an average of nine miles per hour, while
the LLC Monorail is assumed to require 27.5 minutes, including terminal dwell
time, to complete a round trip of 3.9 miles.
40. LLC Monorail "Stated Preference" study.
41. Assumes an average walking speed of 2.5 miles per hour.
42. At a walking speed of 2.5 miles per hour.
43. Based upon the 1996 RTC estimate and increased by two percent annually to
2003.
44. Ridership and Revenue Study.
45. Actually, the fare recovery ratio is higher, since the projected operating cost
includes some funds for capital renewal. Project officials indicated that more
precise operating cost only data was not yet available.
46. Ridership and Revenue Study.
47. Calculated from the 1997 Federal Transit Administration National Transit
Database. Calculation includes all systems operating more than 200 transit
vehicles and all fixed guideway systems.
48. Some commuter rail systems have higher average fares. Commuter rail systems
typically carry riders over much longer distances (in 1997, the average commuter
rail trip length was more than 20 miles, which compares to under five miles for
the average bus, light rail or heavy rail trip). Calculated from National Transit
Database.
49. While the single adult fare on the Las Vegas Strip bus route is $2.00, lower fares
are charged for bus passes and eligible senior citizens and youth.
50. Metropolitan Research Association, 1999 Las Vegas Perspective.
51. The final fare increase would be less than 12.5 percent, so that the $2.00 fare is
reached.
52. The final fare increase would be less than 12.5 percent, so that the $2.00 fare is
reached.
53. The National Transit Database does not collect advertising revenue data
specifically, and as a result immediately available transit agency annual reports
and budgets were consulted.
54. Annual report of the Washington Area Metropolitan Transit Authority, 1994.
55. Transit system annual reports for Indianapolis and San Antonio, 1997. Transit
agency 1999 budget for Austin.
56. LLC Monorail representatives indicate that a detailed advertising revenue
projection study will soon be available. These conclusions are subject to revision
based upon a review of that document.
57. Don Pickrell, Urban Rail l Transit Projects: Forecast Versus Actual Ridership
and Costs (Washington, DC: Urban Mass Transportation Administration, US
Department of Transportation, October 1989).
58. Mette K. Skamris and Bent Flyvbjerg, "Accuracy of Traffic Forecasts and Cost
Estimates on Large Transportation Projects," Transportation Research Record
(Washington, DC: Transportation Research Board, National Research Council),
1996.
59. "Eurotunnel: Au Revoir Alastair," The Sunday Times (London), October 6, 1997.
60. Pickrell.
61. Pickrell.
62. It would be preferable to obtain the guarantee of the financially stronger parent
Bombardier Corporation, rather than this subsidiary.
63. Minutes of the Regional Transportation Commission meeting, October 14, 1999.
64. The financial projections pertain only to operations from 2003 to 2035.
65. A detailed advertising report is due soon. This projection, however, indicates that
even if the advertising projections turn out to be accurate, the project is not likely
to earn enough revenue to meet its obligations.
66. LLC Monorail officials expressed concern that this report's estimate of business
license fees was high. A definition of the appropriate calculation method is yet to
be provided. However, license fees are small relative to project revenues and
expenses and could not therefore make a material difference in the projections.
67. Estimated from RTC data. In 1998 it is estimated that tourist fare revenues on the
route amounted to nearly $7 million.
68. A higher than projected diversion of bus riders Monorail would not guarantee the
financial success of the LLC Monorail. The 10,000 daily Route 301 tourist riders
is less than one-fifth the projected LLC Monorail ridership.
69. The new projections are contained in Salomon Smith Barney, Notes to Financing
Schedules: Preliminary Analysis, April 3, 2000.
70. Last year common to both projections.
71. Calculated from 1998 National Transit Database.
|
Table # A-4 |
|
LLC MONORAIL |
|
OPERATING COST ANALYSIS |
|
Proponent's Projection (#1) |
|
Fiscal Year Ended 12/31 |
|
SOURCES & USES OF FUNDS |
2003 |
2004 |
2005 |
2006 |
2007 |
2008 |
|
Annual Ridership |
4,784,500 |
19,536,000 |
19,935,000 |
20,171,000 |
20,566,000 |
20,961,000 |
|
Fare |
$2.50 |
$2.50 |
$2.50 |
$2.75 |
$2.75 |
$2.75 |
|
|
|
|
|
|
|
|
|
Sources of Funds |
|
|
|
|
|
|
|
Fare Revenue |
$11,961,250 |
$48,840,000 |
$49,837,500 |
$55,470,250 |
$56,556,500 |
$57,642,750 |
|
Advertising |
$1,625,000 |
$6,695,000 |
$6,895,850 |
$7,102,726 |
$7,315,807 |
$7,535,281 |
|
Interest & Reserve Fund Earnings |
$988,355 |
$5,079,469 |
$5,276,403 |
$5,276,403 |
$5,276,403 |
$5,276,403 |
|
Total Sources of Funds |
$14,574,605 |
$60,614,469 |
$62,009,753 |
$67,849,379 |
$69,148,710 |
$70,454,434 |
|
|
|
|
|
|
|
|
|
Uses of Funds |
|
|
|
|
|
|
|
Operations/Maintenance/Replacement |
$6,310,826 |
$13,000,302 |
$13,390,311 |
$13,792,020 |
$14,205,781 |
$14,837,678 |
|
LLC Management & Oversight |
$5,101,000 |
$5,150,000 |
$5,304,500 |
$5,463,635 |
$5,627,544 |
$5,796,370 |
|
Business License Fee |
$50,000 |
$584,977 |
$218,008 |
$245,590 |
$249,074 |
$251,410 |
|
Property Tax |
$1,951,007 |
$2,009,537 |
$2,069,823 |
$2,131,918 |
$2,195,876 |
$2,261,752 |
|
Total Uses Before Debt Service |
$13,412,833 |
$20,744,816 |
$20,982,642 |
$21,633,163 |
$22,278,275 |
$23,147,210 |
|
|
|
|
|
|
|
|
|
Net Cash Flow Before Debt Service |
$1,161,772 |
$39,869,653 |
$41,027,111 |
$46,216,215 |
$46,870,436 |
$47,307,224 |
|
|
|
|
|
|
|
|
|
Debt Service (Net) |
|
|
|
|
|
|
|
1st Lien-Post Capitalized Interest |
$0 |
$5,689,685 |
$23,178,739 |
$26,108,739 |
$26,478,739 |
$26,728,763 |
|
2nd Lien-Post Capitalized Interest |
$0 |
$1,658,248 |
$6,947,993 |
$7,827,993 |
$7,937,993 |
$8,007,993 |
|
3rd Lien-Post Capitalized Interest |
$0 |
$0 |
$0 |
$0 |
$0 |
$0 |
|
Total Debt Service |
$0 |
$7,347,933 |
$30,126,732 |
$33,936,732 |
$34,416,732 |
$34,736,756 |
|
|
|
|
|
|
|
|
|
Net Cash Flow After Debt Service |
$1,161,772 |
$32,521,720 |
$10,900,379 |
$12,279,483 |
$12,453,704 |
$12,570,468 |
|
|
|
|
|
|
|
|
|
Net Cash Flow Compared to Plan |
$0 |
$0 |
$0 |
$0 |
$0 |
$0 |
|
|
|
|
|
|
|
|
|
Reserves and Funds: Planned |
|
|
|
|
|
|
|
Debt Service Reserves |
$54,606,712 |
$54,606,712 |
$54,606,712 |
$54,606,712 |
$54,606,712 |
$54,606,712 |
|
General Fund |
$24,687,574 |
$50,000,000 |
$50,000,000 |
$50,000,000 |
$50,000,000 |
$50,000,000 |
|
Total |
$79,294,286 |
$104,606,712 |
$104,606,712 |
$104,606,712 |
$104,606,712 |
$104,606,712 |
|
|
|
|
|
|
|
|
|
SOURCES & USES OF FUNDS |
2009 |
2010 |
2011 |
2012 |
2013 |
2014 |
|
Annual Ridership |
21,229,000 |
21,622,000 |
21,730,000 |
21,751,000 |
21,860,000 |
21,970,000 |
|
Fare |
$3.00 |
$3.00 |
$3.00 |
$3.25 |
$3.25 |
$3.25 |
|
|
|
|
|
|
|
|
|
Sources of Funds |
|
|
|
|
|
|
|
Fare Revenue |
$63,687,000 |
$64,866,000 |
$65,190,000 |
$70,690,750 |
$71,045,000 |
$71,402,500 |
|
Advertising |
$7,761,340 |
$7,994,180 |
$8,234,006 |
$8,481,026 |
$8,735,456 |
$8,997,520 |
|
Interest & Reserve Fund Earnings |
$5,276,403 |
$5,276,403 |
$5,276,403 |
$5,276,403 |
$5,276,403 |
$5,276,403 |
|
Total Sources of Funds |
$76,724,743 |
$78,136,583 |
$78,700,409 |
$84,448,179 |
$85,056,859 |
$85,676,423 |
|
|
|
|
|
|
|
|
|
Uses of Funds |
|
|
|
|
|
|
|
Operations/Maintenance/Replacement |
$15,282,808 |
$15,741,293 |
$16,213,531 |
$16,699,937 |
$17,259,677 |
$17,777,467 |
|
LLC Management & Oversight |
$5,970,261 |
$6,149,369 |
$6,333,850 |
$6,523,866 |
$6,719,582 |
$6,921,169 |
|
Business License Fee |
$280,889 |
$97,739 |
$97,447 |
$106,510 |
$106,056 |
$105,792 |
|
Property Tax |
$2,329,604 |
$2,399,493 |
$2,471,477 |
$2,545,622 |
$2,621,990 |
$2,700,650 |
|
Total Uses Before Debt Service |
$23,863,563 |
$24,387,893 |
$25,116,306 |
$25,875,935 |
$26,707,305 |
$27,505,079 |
|
|
|
|
|
|
|
|
|
Net Cash Flow Before Debt Service |
$52,861,180 |
$53,748,690 |
$53,584,102 |
$58,572,244 |
$58,349,554 |
$58,171,345 |
|
|
|
|
|
|
|
|
|
Debt Service (Net) |
|
|
|
|
|
|
|
1st Lien-Post Capitalized Interest |
$29,863,739 |
$30,368,739 |
$30,273,739 |
$33,093,739 |
$32,963,739 |
$32,863,739 |
|
2nd Lien-Post Capitalized Interest |
$8,952,993 |
$9,097,993 |
$9,072,993 |
$9,387,993 |
$9,352,993 |
$9,322,993 |
|
3rd Lien-Post Capitalized Interest |
$0 |
$9,395,000 |
$9,365,000 |
$10,765,000 |
$10,730,000 |
$10,695,000 |
|
Total Debt Service |
$38,816,732 |
$48,861,732 |
$48,711,732 |
$53,246,732 |
$53,046,732 |
$52,881,732 |
|
|
|
|
|
|
|
|
|
Net Cash Flow After Debt Service |
$14,044,448 |
$4,886,958 |
$4,872,370 |
$5,325,512 |
$5,302,822 |
$5,289,613 |
|
|
|
|
|
|
|
|
|
Net Cash Flow Compared to Plan |
$0 |
$0 |
$0 |
$0 |
$0 |
$0 |
|
|
|
|
|
|
|
|
|
Reserves and Funds: Planned |
|
|
|
|
|
|
|
Debt Service Reserves |
$54,606,712 |
$54,606,712 |
$54,606,712 |
$54,606,712 |
$54,606,712 |
$54,606,712 |
|
General Fund |
$50,000,000 |
$50,000,000 |
$50,000,000 |
$50,000,000 |
$50,000,000 |
$50,000,000 |
|
Total |
$104,606,712 |
$104,606,712 |
$104,606,712 |
$104,606,712 |
$104,606,712 |
$104,606,712 |
|
|
|
|
|
|
|
|
|
SOURCES & USES OF FUNDS |
2015 |
2016 |
2017 |
2018 |
2019 |
2020 |
|
Annual Ridership |
22,013,000 |
22,123,000 |
22,234,000 |
22,300,000 |
22,412,000 |
22,524,000 |
|
Fare |
$3.50 |
$3.50 |
$3.50 |
$3.75 |
$3.75 |
$3.75 |
|
|
|
|
|
|
|
|
|
Sources of Funds |
|
|
|
|
|
|
|
Fare Revenue |
$77,045,500 |
$77,430,500 |
$77,819,000 |
$83,625,000 |
$84,045,000 |
$84,465,000 |
|
Advertising |
$9,267,446 |
$9,545,469 |
$9,831,833 |
$10,126,788 |
$10,430,592 |
$10,743,510 |
|
Interest & Reserve Fund Earnings |
$5,276,403 |
$5,276,403 |
$5,276,403 |
$5,276,403 |
$5,276,403 |
$5,276,403 |
|
Total Sources of Funds |
$91,589,349 |
$92,252,372 |
$92,927,236 |
$99,028,191 |
$99,751,995 |
$100,484,913 |
|
|
|
|
|
|
|
|
|
Uses of Funds |
|
|
|
|
|
|
|
Operations/Maintenance/Replacement |
$18,310,791 |
$18,860,115 |
$19,425,919 |
$20,018,570 |
$20,619,127 |
$21,237,701 |
|
LLC Management & Oversight |
$7,128,804 |
$7,342,669 |
$7,562,949 |
$7,789,837 |
$8,023,532 |
$8,264,238 |
|
Business License Fee |
$115,027 |
$114,862 |
$114,325 |
$123,695 |
$123,369 |
$122,971 |
|
Property Tax |
$2,781,669 |
$2,865,120 |
$2,951,073 |
$3,039,605 |
$3,130,793 |
$3,224,717 |
|
Total Uses Before Debt Service |
$28,336,292 |
$29,182,765 |
$30,054,265 |
$30,971,707 |
$31,896,822 |
$32,849,627 |
|
|
|
|
|
|
|
|
|
Net Cash Flow Before Debt Service |
$63,253,057 |
$63,069,607 |
$62,872,971 |
$68,056,484 |
$67,855,173 |
$67,635,285 |
|
|
|
|
|
|
|
|
|
Debt Service (Net) |
|
|
|
|
|
|
|
1st Lien-Post Capitalized Interest |
$35,393,739 |
$35,293,739 |
$35,183,739 |
$38,083,739 |
$37,973,739 |
$37,848,739 |
|
2nd Lien-Post Capitalized Interest |
$10,477,933 |
$10,447,993 |
$10,412,993 |
$11,272,993 |
$11,237,993 |
$11,202,993 |
|
3rd Lien-Post Capitalized Interest |
$11,630,000 |
$11,595,000 |
$11,560,000 |
$12,515,000 |
$12,475,000 |
$12,435,000 |
|
Total Debt Service |
$57,501,672 |
$57,336,732 |
$57,156,732 |
$61,871,732 |
$61,686,732 |
$61,486,732 |
|
|
|
|
|
|
|
|
|
Net Cash Flow After Debt Service |
$5,751,385 |
$5,732,875 |
$5,716,239 |
$6,184,752 |
$6,168,441 |
$6,148,553 |
|
|
|
|
|
|
|
|
|
Net Cash Flow Compared to Plan |
$0 |
$0 |
$0 |
$0 |
$0 |
$0 |
|
|
|
|
|
|
|
|
|
Reserves and Funds: Planned |
|
|
|
|
|
|
|
Debt Service Reserves |
$54,606,712 |
$54,606,712 |
$54,606,712 |
$54,606,712 |
$54,606,712 |
$54,606,712 |
|
General Fund |
$50,000,000 |
$50,000,000 |
$50,000,000 |
$50,000,000 |
$50,000,000 |
$50,000,000 |
|
Total |
$104,606,712 |
$104,606,712 |
$104,606,712 |
$104,606,712 |
$104,606,712 |
$104,606,712 |
|
|
|
|
|
|
|
|
|
SOURCES & USES OF FUNDS |
2021 |
2022 |
2023 |
2024 |
2025 |
2026 |
|
Annual Ridership |
22,614,000 |
22,727,000 |
22,841,000 |
22,898,000 |
22,955,000 |
23,012,000 |
|
Fare |
$4.00 |
$4.00 |
$4.00 |
$4.25 |
$4.25 |
$4.25 |
|
|
|
|
|
|
|
|
|
Sources of Funds |
|
|
|
|
|
|
|
Fare Revenue |
$90,456,000 |
$90,908,000 |
$91,364,000 |
$97,316,500 |
$97,558,750 |
$97,801,000 |
|
Advertising |
$11,065,815 |
$11,397,789 |
$11,739,723 |
$12,091,915 |
$12,454,672 |
$12,828,312 |
|
Interest & Reserve Fund Earnings |
$5,276,403 |
$5,276,403 |
$5,276,403 |
$5,276,403 |
$5,276,403 |
$5,276,403 |
|
Total Sources of Funds |
$106,798,218 |
$107,582,192 |
$108,380,126 |
$114,684,818 |
$115,289,825 |
$115,905,715 |
|
|
|
|
|
|
|
|
|
Uses of Funds |
|
|
|
|
|
|
|
Operations/Maintenance/Replacement |
$21,874,832 |
$22,531,077 |
$23,156,091 |
$23,850,774 |
$24,566,297 |
$25,303,286 |
|
LLC Management & Oversight |
$8,512,165 |
$8,767,530 |
$9,030,556 |
$9,301,473 |
$9,580,517 |
$9,867,933 |
|
Business License Fee |
$132,608 |
$372,368 |
$397,118 |
$439,341 |
$436,528 |
$433,652 |
|
Property Tax |
$3,321,459 |
$3,421,103 |
$3,523,736 |
$3,629,448 |
$3,738,331 |
$3,850,481 |
|
Total Uses Before Debt Service |
$33,841,064 |
$35,092,078 |
$36,107,501 |
$37,221,035 |
$38,321,673 |
$39,455,352 |
|
|
|
|
|
|
|
|
|
Net Cash Flow Before Debt Service |
$72,957,154 |
$72,490,115 |
$72,272,625 |
$77,463,782 |
$76,968,152 |
$76,450,364 |
|
|
|
|
|
|
|
|
|
Debt Service (Net) |
|
|
|
|
|
|
|
1st Lien-Post Capitalized Interest |
$40,828,739 |
$40,578,739 |
$40,443,739 |
$40,348,739 |
$42,663,739 |
$42,379,663 |
|
2nd Lien-Post Capitalized Interest |
$12,082,993 |
$11,992,993 |
$11,972,993 |
$12,147,993 |
$12,477,993 |
$12,387,993 |
|
3rd Lien-Post Capitalized Interest |
$13,415,000 |
$1,300,000 |
$0 |
$0 |
$0 |
$0 |
|
Total Debt Service |
$66,326,732 |
$53,871,732 |
$52,416,732 |
$52,496,732 |
$55,141,732 |
$54,767,656 |
|
|
|
|
|
|
|
|
|
Net Cash Flow After Debt Service |
$6,630,422 |
$18,618,383 |
$19,855,893 |
$24,967,050 |
$21,826,420 |
$21,682,708 |
|
|
|
|
|
|
|
|
|
Net Cash Flow Compared to Plan |
$0 |
$0 |
$0 |
$0 |
$0 |
$0 |
|
|
|
|
|
|
|
|
|
Reserves and Funds: Planned |
|
|
|
|
|
|
|
Debt Service Reserves |
$54,606,712 |
$54,606,712 |
$54,606,712 |
$54,606,712 |
$54,606,712 |
$54,606,712 |
|
General Fund |
$50,000,000 |
$50,000,000 |
$50,000,000 |
$50,000,000 |
$50,000,000 |
$50,000,000 |
|
Total |
$104,606,712 |
$104,606,712 |
$104,606,712 |
$104,606,712 |
$104,606,712 |
$104,606,712 |
|
|
|
|
|
|
|
|
|
SOURCES & USES OF FUNDS |
2027 |
2028 |
2029 |
2030 |
2031 |
2032 |
|
Annual Ridership |
23,070,000 |
23,127,000 |
23,185,000 |
23,243,000 |
23,301,000 |
23,360,000 |
|
Fare |
$4.50 |
$4.50 |
$4.50 |
$4.75 |
$4.75 |
$4.75 |
|
|
|
|
|
|
|
|
|
Sources of Funds |
|
|
|
|
|
|
|
Fare Revenue |
$103,815,000 |
$104,071,500 |
$104,332,500 |
$110,404,250 |
$110,679,750 |
$110,960,000 |
|
Advertising |
$13,213,162 |
$13,609,557 |
$14,017,843 |
$14,438,379 |
$14,871,530 |
$15,317,676 |
|
Interest & Reserve Fund Earnings |
$5,276,403 |
$5,276,403 |
$5,276,403 |
$5,276,403 |
$5,276,403 |
$5,276,403 |
|
Total Sources of Funds |
$122,304,565 |
$122,957,460 |
$123,626,746 |
$130,119,032 |
$130,827,683 |
$131,554,079 |
|
|
|
|
|
|
|
|
|
Uses of Funds |
|
|
|
|
|
|
|
Operations/Maintenance/Replacement |
$26,062,384 |
$26,994,801 |
$27,804,645 |
$28,638,784 |
$29,497,948 |
$30,382,886 |
|
LLC Management & Oversight |
$10,163,971 |
$10,468,890 |
$10,782,956 |
$11,106,445 |
$11,439,638 |
$11,782,828 |
|
Business License Fee |
$463,060 |
$459,139 |
$455,871 |
$485,286 |
$481,734 |
$492,602 |
|
Property Tax |
$3,965,996 |
$4,084,975 |
$4,207,525 |
$4,333,750 |
$4,463,763 |
$4,597,676 |
|
Total Uses Before Debt Service |
$40,655,410 |
$42,007,805 |
$43,250,997 |
$44,564,266 |
$45,883,083 |
$47,255,992 |
|
|
|
|
|
|
|
|
|
Net Cash Flow Before Debt Service |
$81,649,154 |
$80,949,654 |
$80,375,749 |
$85,554,766 |
$84,944,600 |
$84,298,087 |
|
|
|
|
|
|
|
|
|
Debt Service (Net) |
|
|
|
|
|
|
|
1st Lien-Post Capitalized Interest |
$45,262,468 |
$44,872,348 |
$44,555,710 |
$47,423,030 |
$47,086,663 |
$46,726,393 |
|
2nd Lien-Post Capitalized Interest |
$13,233,704 |
$13,120,359 |
$13,026,484 |
$13,868,974 |
$13,771,244 |
$12,941,599 |
|
3rd Lien-Post Capitalized Interest |
$0 |
$0 |
$0 |
$0 |
$0 |
$0 |
|
Total Debt Service |
$58,496,172 |
$57,992,707 |
$57,582,194 |
$61,292,004 |
$60,857,907 |
$59,667,992 |
|
|
|
|
|
|
|
|
|
Net Cash Flow After Debt Service |
$23,152,982 |
$22,956,947 |
$22,793,555 |
$24,262,762 |
$24,086,693 |
$24,630,095 |
|
|
|
|
|
|
|
|
|
Net Cash Flow Compared to Plan |
$0 |
$0 |
$0 |
$0 |
$0 |
$0 |
|
|
|
|
|
|
|
|
|
Reserves and Funds: Planned |
|
|
|
|
|
|
|
Debt Service Reserves |
$54,606,712 |
$54,606,712 |
$54,606,712 |
$54,606,712 |
$54,606,712 |
$54,606,712 |
|
General Fund |
$50,000,000 |
$50,000,000 |
$50,000,000 |
$50,000,000 |
$50,000,000 |
$50,000,000 |
|
Total |
$104,606,712 |
$104,606,712 |
$104,606,712 |
$104,606,712 |
$104,606,712 |
$104,606,712 |
|
|
|
|
|
|
|
|
|
SOURCES & USES OF FUNDS |
2033 |
2034 |
2035 |
|
|
|
|
Annual Ridership |
23,418,000 |
23,477,000 |
23,535,000 |
|
|
|
|
Fare |
$5.00 |
$5.00 |
$5.00 |
|
|
|
|
|
|
|
|
|
|
|
|
Sources of Funds |
|
|
|
|
|
|
|
Fare Revenue |
$117,090,000 |
$117,090,000 |
$117,090,000 |
|
|
|
|
Advertising |
$15,777,206 |
$16,250,522 |
$16,738,038 |
|
|
|
|
Interest & Reserve Fund Earnings |
$5,276,403 |
$5,276,403 |
$59,883,184 |
|
|
|
|
Total Sources of Funds |
$138,143,609 |
$138,616,925 |
$193,711,222 |
|
|
|
|
|
|
|
|
|
|
|
|
Uses of Funds |
|
|
|
|
|
|
|
Operations/Maintenance/Replacement |
$31,170,774 |
$32,269,812 |
$33,237,906 |
|
|
|
|
LLC Management & Oversight |
$12,136,312 |
$12,500,402 |
$12,875,414 |
|
|
|
|
Business License Fee |
$523,453 |
$516,894 |
$1,424,761 |
|
|
|
|
Property Tax |
$4,735,606 |
$4,877,674 |
$5,024,004 |
|
|
|
|
Total Uses Before Debt Service |
$48,566,145 |
$50,164,782 |
$52,562,085 |
|
|
|
|
|
|
|
|
|
|
|
|
Net Cash Flow Before Debt Service |
$89,577,464 |
$88,452,143 |
$141,149,137 |
|
|
|
|
|
|
|
|
|
|
|
|
Debt Service (Net) |
|
|
|
|
|
|
|
1st Lien-Post Capitalized Interest |
$49,191,823 |
$48,575,563 |
$53,429,155 |
|
|
|
|
2nd Lien-Post Capitalized Interest |
$14,212,994 |
$14,031,875 |
$16,481,850 |
|
|
|
|
3rd Lien-Post Capitalized Interest |
$0 |
$0 |
$0 |
|
|
|
|
Total Debt Service |
$63,404,817 |
$62,607,438 |
$69,911,005 |
|
|
|
|
|
|
|
|
|
|
|
|
Net Cash Flow After Debt Service |
$26,172,647 |
$25,844,705 |
$71,238,132 |
|
|
|
|
|
|
|
|
|
|
|
|
Net Cash Flow Compared to Plan |
$0 |
$0 |
|
|
|
|
|
|
|
|
|
|
|
|
|
Reserves and Funds: Planned |
|
|
|
|
|
|
|
Debt Service Reserves |
$54,606,712 |
$54,606,712 |
$0 |
|
|
|
|
General Fund |
$50,000,000 |
$50,000,000 |
$50,000,000 |
|
|
|
|
Total |
$104,606,712 |
$104,606,712 |
$50,000,000 |
|
|
|
|
|
|
|
|
|
|
|
|
Table # A-5 |
|
LLC MONORAIL |
|
OPERATING COST ANALYSIS |
|
Revised: Optimistic Ridership Projection (#2) |
|
Fiscal Year Ended 12/31 |
|
SOURCES & USES OF FUNDS |
2003 |
2004 |
2005 |
2006 |
2007 |
2008 |
|
Annual Ridership |
2,239,686 |
9,145,053 |
9,331,830 |
9,328,126 |
9,510,795 |
9,693,464 |
|
Fare |
$2.50 |
$2.50 |
$2.50 |
$2.75 |
$2.75 |
$2.75 |
|
|
|
|
|
|
|
|
|
Sources of Funds |
|
|
|
|
|
|
|
Fare Revenue |
$5,599,215 |
$22,862,632 |
$23,329,575 |
$25,652,348 |
$26,154,686 |
$26,657,025 |
|
Advertising |
$1,625,000 |
$6,695,000 |
$6,895,850 |
$7,102,726 |
$7,315,807 |
$7,535,281 |
|
Interest & Reserve Fund Earnings |
$988,355 |
$5,079,469 |
$5,276,403 |
$5,276,403 |
$5,276,403 |
$5,276,403 |
|
Total Sources of Funds |
$8,212,570 |
$34,637,101 |
$35,501,828 |
$38,031,476 |
$38,746,897 |
$39,468,710 |
|
|
|
|
|
|
|
|
|
Uses of Funds |
|
|
|
|
|
|
|
Operations/Maintenance/Replacement |
$6,310,826 |
$13,000,302 |
$13,390,311 |
$13,792,020 |
$14,205,781 |
$14,837,678 |
|
LLC Management & Oversight |
$5,101,000 |
$5,150,000 |
$5,304,500 |
$5,463,635 |
$5,627,544 |
$5,796,370 |
|
Business License Fee |
$50,000 |
$584,977 |
$218,008 |
$245,590 |
$249,074 |
$251,410 |
|
Property Tax |
$1,951,007 |
$2,009,537 |
$2,069,823 |
$2,131,918 |
$2,195,876 |
$2,261,752 |
|
Total Uses Before Debt Service |
$13,412,833 |
$20,744,816 |
$20,982,642 |
$21,633,163 |
$22,278,275 |
$23,147,210 |
|
|
|
|
|
|
|
|
|
Net Cash Flow Before Debt Service |
($5,200,263) |
$13,892,285 |
$14,519,185 |
$16,398,313 |
$16,468,622 |
$16,321,500 |
|
|
|
|
|
|
|
|
|
Debt Service (Net) |
|
|
|
|
|
|
|
1st Lien-Post Capitalized Interest |
$0 |
$5,689,685 |
$23,178,739 |
$26,108,739 |
$26,478,739 |
$26,728,763 |
|
2nd Lien-Post Capitalized Interest |
$0 |
$1,658,248 |
$6,947,993 |
$7,827,993 |
$7,937,993 |
$8,007,993 |
|
3rd Lien-Post Capitalized Interest |
$0 |
$0 |
$0 |
$0 |
$0 |
$0 |
|
Total Debt Service |
$0 |
$7,347,933 |
$30,126,732 |
$33,936,732 |
$34,416,732 |
$34,736,756 |
|
|
|
|
|
|
|
|
|
Net Cash Flow After Debt Service |
($5,200,263) |
$6,544,352 |
($15,607,547) |
($17,538,419) |
($17,948,110) |
($18,415,256) |
|
|
|
|
|
|
|
|
|
Net Cash Flow Compared to Plan |
($6,362,035) |
($25,977,368) |
($26,507,925) |
($29,817,902) |
($30,401,814) |
($30,985,725) |
|
Accumulated Difference |
($6,362,035) |
($32,339,403) |
($58,847,328) |
($88,665,231) |
($119,067,044) |
($150,052,769) |
|
|
|
|
|
|
|
|
|
Reserves and Funds: Planned |
|
|
|
|
|
|
|
Debt Service Reserves |
$54,606,712 |
$54,606,712 |
$54,606,712 |
$54,606,712 |
$54,606,712 |
$54,606,712 |
|
General Fund |
$24,687,574 |
$50,000,000 |
$50,000,000 |
$50,000,000 |
$50,000,000 |
$50,000,000 |
|
Total |
$79,294,286 |
$104,606,712 |
$104,606,712 |
$104,606,712 |
$104,606,712 |
$104,606,712 |
|
|
|
|
|
|
|
|
|
Reserves & Funds + Accumulated Difference |
$72,932,251 |
$72,267,309 |
$45,759,384 |
$15,941,481 |
($14,460,332) |
($45,446,057) |
|
|
|
|
|
|
|
|
|
SOURCES & USES OF FUNDS |
2009 |
2010 |
2011 |
2012 |
2013 |
2014 |
|
Annual Ridership |
9,696,708 |
9,876,218 |
9,925,549 |
9,808,954 |
9,858,109 |
9,907,715 |
|
Fare |
$3.00 |
$3.00 |
$3.00 |
$3.25 |
$3.25 |
$3.25 |
|
|
|
|
|
|
|
|
|
Sources of Funds |
|
|
|
|
|
|
|
Fare Revenue |
$29,090,125 |
$29,628,653 |
$29,776,646 |
$31,879,099 |
$32,038,854 |
$32,200,074 |
|
Advertising |
$7,761,340 |
$7,994,180 |
$8,234,006 |
$8,481,026 |
$8,735,456 |
$8,997,520 |
|
Interest & Reserve Fund Earnings |
$5,276,403 |
$5,276,403 |
$5,276,403 |
$5,276,403 |
$5,276,403 |
$5,276,403 |
|
Total Sources of Funds |
$42,127,868 |
$42,899,237 |
$43,287,054 |
$45,636,528 |
$46,050,713 |
$46,473,997 |
|
|
|
|
|
|
|
|
|
Uses of Funds |
|
|
|
|
|
|
|
Operations/Maintenance/Replacement |
$15,282,808 |
$15,741,293 |
$16,213,531 |
$16,699,937 |
$17,259,677 |
$17,777,467 |
|
LLC Management & Oversight |
$5,970,261 |
$6,149,369 |
$6,333,850 |
$6,523,866 |
$6,719,582 |
$6,921,169 |
|
Business License Fee |
$280,889 |
$97,739 |
$97,447 |
$106,510 |
$106,056 |
$105,792 |
|
Property Tax |
$2,329,604 |
$2,399,493 |
$2,471,477 |
$2,545,622 |
$2,621,990 |
$2,700,650 |
|
Total Uses Before Debt Service |
$23,863,563 |
$24,387,893 |
$25,116,306 |
$25,875,935 |
$26,707,305 |
$27,505,079 |
|
|
|
|
|
|
|
|
|
Net Cash Flow Before Debt Service |
$18,264,305 |
$18,511,343 |
$18,170,748 |
$19,760,593 |
$19,343,408 |
$18,968,918 |
|
|
|
|
|
|
|
|
|
Debt Service (Net) |
|
|
|
|
|
|
|
1st Lien-Post Capitalized Interest |
$29,863,739 |
$30,368,739 |
$30,273,739 |
$33,093,739 |
$32,963,739 |
$32,863,739 |
|
2nd Lien-Post Capitalized Interest |
$8,952,993 |
$9,097,993 |
$9,072,993 |
$9,387,993 |
$9,352,993 |
$9,322,993 |
|
3rd Lien-Post Capitalized Interest |
$0 |
$9,395,000 |
$9,365,000 |
$10,765,000 |
$10,730,000 |
$10,695,000 |
|
Total Debt Service |
$38,816,732 |
$48,861,732 |
$48,711,732 |
$53,246,732 |
$53,046,732 |
$52,881,732 |
|
|
|
|
|
|
|
|
|
Net Cash Flow After Debt Service |
($20,552,427) |
($30,350,389) |
($30,540,984) |
($33,486,139) |
($33,703,324) |
($33,912,814) |
|
|
|
|
|
|
|
|
|
Net Cash Flow Compared to Plan |
($34,596,875) |
($35,237,347) |
($35,413,354) |
($38,811,651) |
($39,006,146) |
($39,202,426) |
|
Accumulated Difference |
($184,649,644) |
($219,886,991) |
($255,300,345) |
($294,111,996) |
($333,118,142) |
($372,320,568) |
|
|
|
|
|
|
|
|
|
Reserves and Funds: Planned |
|
|
|
|
|
|
|
Debt Service Reserves |
$54,606,712 |
$54,606,712 |
$54,606,712 |
$54,606,712 |
$54,606,712 |
$54,606,712 |
|
General Fund |
$50,000,000 |
$50,000,000 |
$50,000,000 |
$50,000,000 |
$50,000,000 |
$50,000,000 |
|
Total |
$104,606,712 |
$104,606,712 |
$104,606,712 |
$104,606,712 |
$104,606,712 |
$104,606,712 |
|
|
|
|
|
|
|
|
|
Reserves & Funds + Accumulated Difference |
($80,042,932) |
($115,280,279) |
($150,693,633) |
($189,505,284) |
($228,511,430) |
($267,713,856) |
|
|
|
|
|
|
|
|
|
SOURCES & USES OF FUNDS |
2015 |
2016 |
2017 |
2018 |
2019 |
2020 |
|
Annual Ridership |
9,804,065 |
9,853,056 |
9,902,493 |
9,809,834 |
9,859,103 |
9,908,372 |
|
Fare |
$3.50 |
$3.50 |
$3.50 |
$3.75 |
$3.75 |
$3.75 |
|
|
|
|
|
|
|
|
|
Sources of Funds |
|
|
|
|
|
|
|
Fare Revenue |
$34,314,228 |
$34,485,698 |
$34,658,726 |
$36,786,878 |
$36,971,637 |
$37,156,397 |
|
Advertising |
$9,267,446 |
$9,545,469 |
$9,831,833 |
$10,126,788 |
$10,430,592 |
$10,743,510 |
|
Interest & Reserve Fund Earnings |
$5,276,403 |
$5,276,403 |
$5,276,403 |
$5,276,403 |
$5,276,403 |
$5,276,403 |
|
Total Sources of Funds |
$48,858,077 |
$49,307,570 |
$49,766,963 |
$52,190,069 |
$52,678,632 |
$53,176,309 |
|
|
|
|
|
|
|
|
|
Uses of Funds |
|
|
|
|
|
|
|
Operations/Maintenance/Replacement |
$18,310,791 |
$18,860,115 |
$19,425,919 |
$20,018,570 |
$20,619,127 |
$21,237,701 |
|
LLC Management & Oversight |
$7,128,804 |
$7,342,669 |
$7,562,949 |
$7,789,837 |
$8,023,532 |
$8,264,238 |
|
Business License Fee |
$115,027 |
$114,862 |
$114,325 |
$123,695 |
$123,369 |
$122,971 |
|
Property Tax |
$2,781,669 |
$2,865,120 |
$2,951,073 |
$3,039,605 |
$3,130,793 |
$3,224,717 |
|
Total Uses Before Debt Service |
$28,336,292 |
$29,182,765 |
$30,054,265 |
$30,971,707 |
$31,896,822 |
$32,849,627 |
|
|
|
|
|
|
|
|
|
Net Cash Flow Before Debt Service |
$20,521,784 |
$20,124,805 |
$19,712,697 |
$21,218,362 |
$20,781,811 |
$20,326,682 |
|
|
|
|
|
|
|
|
|
Debt Service (Net) |
|
|
|
|
|
|
|
1st Lien-Post Capitalized Interest |
$35,393,739 |
$35,293,739 |
$35,183,739 |
$38,083,739 |
$37,973,739 |
$37,848,739 |
|
2nd Lien-Post Capitalized Interest |
$10,477,933 |
$10,447,993 |
$10,412,993 |
$11,272,993 |
$11,237,993 |
$11,202,993 |
|
3rd Lien-Post Capitalized Interest |
$11,630,000 |
$11,595,000 |
$11,560,000 |
$12,515,000 |
$12,475,000 |
$12,435,000 |
|
Total Debt Service |
$57,501,672 |
$57,336,732 |
$57,156,732 |
$61,871,732 |
$61,686,732 |
$61,486,732 |
|
|
|
|
|
|
|
|
|
Net Cash Flow After Debt Service |
($36,979,888) |
($37,211,927) |
($37,444,035) |
($40,653,370) |
($40,904,921) |
($41,160,050) |
|
|
|
|
|
|
|
|
|
Net Cash Flow Compared to Plan |
($42,731,272) |
($42,944,802) |
($43,160,274) |
($46,838,122) |
($47,073,363) |
($47,308,603) |
|
Accumulated Difference |
($415,051,840) |
($457,996,642) |
($501,156,916) |
($547,995,038) |
($595,068,400) |
($642,377,003) |
|
|
|
|
|
|
|
|
|
Reserves and Funds: Planned |
|
|
|
|
|
|
|
Debt Service Reserves |
$54,606,712 |
$54,606,712 |
$54,606,712 |
$54,606,712 |
$54,606,712 |
$54,606,712 |
|
General Fund |
$50,000,000 |
$50,000,000 |
$50,000,000 |
$50,000,000 |
$50,000,000 |
$50,000,000 |
|
Total |
$104,606,712 |
$104,606,712 |
$104,606,712 |
$104,606,712 |
$104,606,712 |
$104,606,712 |
|
|
|
|
|
|
|
|
|
Reserves & Funds + Accumulated Difference |
($310,445,128) |
($353,389,930) |
($396,550,204) |
($443,388,326) |
($490,461,688) |
($537,770,291) |
|
|
|
|
|
|
|
|
|
SOURCES & USES OF FUNDS |
2021 |
2022 |
2023 |
2024 |
2025 |
2026 |
|
Annual Ridership |
9,825,142 |
9,874,237 |
9,923,767 |
9,824,175 |
9,848,631 |
9,873,086 |
|
Fare |
$4.00 |
$4.00 |
$4.00 |
$4.25 |
$4.25 |
$4.25 |
|
|
|
|
|
|
|
|
|
Sources of Funds |
|
|
|
|
|
|
|
Fare Revenue |
$39,300,568 |
$39,496,950 |
$39,695,069 |
$41,752,746 |
$41,856,681 |
$41,960,616 |
|
Advertising |
$11,065,815 |
$11,397,789 |
$11,739,723 |
$12,091,915 |
$12,454,672 |
$12,828,312 |
|
Interest & Reserve Fund Earnings |
$5,276,403 |
$5,276,403 |
$5,276,403 |
$5,276,403 |
$5,276,403 |
$5,276,403 |
|
Total Sources of Funds |
$55,642,786 |
$56,171,142 |
$56,711,195 |
$59,121,063 |
$59,587,756 |
$60,065,331 |
|
|
|
|
|
|
|
|
|
Uses of Funds |
|
|
|
|
|
|
|
Operations/Maintenance/Replacement |
$21,874,832 |
$22,531,077 |
$23,156,091 |
$23,850,774 |
$24,566,297 |
$25,303,286 |
|
LLC Management & Oversight |
$8,512,165 |
$8,767,530 |
$9,030,556 |
$9,301,473 |
$9,580,517 |
$9,867,933 |
|
Business License Fee |
$132,608 |
$372,368 |
$397,118 |
$439,341 |
$436,528 |
$433,652 |
|
Property Tax |
$3,321,459 |
$3,421,103 |
$3,523,736 |
$3,629,448 |
$3,738,331 |
$3,850,481 |
|
Total Uses Before Debt Service |
$33,841,064 |
$35,092,078 |
$36,107,501 |
$37,221,035 |
$38,321,673 |
$39,455,352 |
|
|
|
|
|
|
|
|
|
Net Cash Flow Before Debt Service |
$21,801,722 |
$21,079,064 |
$20,603,694 |
$21,900,028 |
$21,266,083 |
$20,609,980 |
|
|
|
|
|
|
|
|
|
Debt Service (Net) |
|
|
|
|
|
|
|
1st Lien-Post Capitalized Interest |
$40,828,739 |
$40,578,739 |
$40,443,739 |
$40,348,739 |
$42,663,739 |
$42,379,663 |
|
2nd Lien-Post Capitalized Interest |
$12,082,993 |
$11,992,993 |
$11,972,993 |
$12,147,993 |
$12,477,993 |
$12,387,993 |
|
3rd Lien-Post Capitalized Interest |
$13,415,000 |
$1,300,000 |
$0 |
$0 |
$0 |
$0 |
|
Total Debt Service |
$66,326,732 |
$53,871,732 |
$52,416,732 |
$52,496,732 |
$55,141,732 |
$54,767,656 |
|
|
|
|
|
|
|
|
|
Net Cash Flow After Debt Service |
($44,525,010) |
($32,792,668) |
($31,813,038) |
($30,596,704) |
($33,875,649) |
($34,157,676) |
|
|
|
|
|
|
|
|
|
Net Cash Flow Compared to Plan |
($51,155,432) |
($51,411,050) |
($51,668,931) |
($55,563,754) |
($55,702,069) |
($55,840,384) |
|
Accumulated Difference |
($693,532,435) |
($744,943,485) |
($796,612,417) |
($852,176,171) |
($907,878,240) |
($963,718,625) |
|
|
|
|
|
|
|
|
|
Reserves and Funds: Planned |
|
|
|
|
|
|
|
Debt Service Reserves |
$54,606,712 |
$54,606,712 |
$54,606,712 |
$54,606,712 |
$54,606,712 |
$54,606,712 |
|
General Fund |
$50,000,000 |
$50,000,000 |
$50,000,000 |
$50,000,000 |
$50,000,000 |
$50,000,000 |
|
Total |
$104,606,712 |
$104,606,712 |
$104,606,712 |
$104,606,712 |
$104,606,712 |
$104,606,712 |
|
|
|
|
|
|
|
|
|
Reserves & Funds + Accumulated Difference |
($588,925,723) |
($640,336,773) |
($692,005,705) |
($747,569,459) |
($803,271,528) |
($859,111,913) |
|
|
|
|
|
|
|
|
|
SOURCES & USES OF FUNDS |
2027 |
2028 |
2029 |
2030 |
2031 |
2032 |
|
Annual Ridership |
9,781,524 |
9,805,691 |
9,830,283 |
9,745,376 |
9,769,694 |
9,794,432 |
|
Fare |
$4.50 |
$4.50 |
$4.50 |
$4.75 |
$4.75 |
$4.75 |
|
|
|
|
|
|
|
|
|
Sources of Funds |
|
|
|
|
|
|
|
Fare Revenue |
$44,016,857 |
$44,125,611 |
$44,236,273 |
$46,290,536 |
$46,406,048 |
$46,523,552 |
|
Advertising |
$13,213,162 |
$13,609,557 |
$14,017,843 |
$14,438,379 |
$14,871,530 |
$15,317,676 |
|
Interest & Reserve Fund Earnings |
$5,276,403 |
$5,276,403 |
$5,276,403 |
$5,276,403 |
$5,276,403 |
$5,276,403 |
|
Total Sources of Funds |
$62,506,421 |
$63,011,571 |
$63,530,519 |
$66,005,317 |
$66,553,981 |
$67,117,631 |
|
|
|
|
|
|
|
|
|
Uses of Funds |
|
|
|
|
|
|
|
Operations/Maintenance/Replacement |
$26,062,384 |
$26,994,801 |
$27,804,645 |
$28,638,784 |
$29,497,948 |
$30,382,886 |
|
LLC Management & Oversight |
$10,163,971 |
$10,468,890 |
$10,782,956 |
$11,106,445 |
$11,439,638 |
$11,782,828 |
|
Business License Fee |
$463,060 |
$459,139 |
$455,871 |
$485,286 |
$481,734 |
$492,602 |
|
Property Tax |
$3,965,996 |
$4,084,975 |
$4,207,525 |
$4,333,750 |
$4,463,763 |
$4,597,676 |
|
Total Uses Before Debt Service |
$40,655,410 |
$42,007,805 |
$43,250,997 |
$44,564,266 |
$45,883,083 |
$47,255,992 |
|
|
|
|
|
|
|
|
|
Net Cash Flow Before Debt Service |
$21,851,011 |
$21,003,765 |
$20,279,522 |
$21,441,051 |
$20,670,898 |
$19,861,639 |
|
|
|
|
|
|
|
|
|
Debt Service (Net) |
|
|
|
|
|
|
|
1st Lien-Post Capitalized Interest |
$45,262,468 |
$44,872,348 |
$44,555,710 |
$47,423,030 |
$47,086,663 |
$46,726,393 |
|
2nd Lien-Post Capitalized Interest |
$13,233,704 |
$13,120,359 |
$13,026,484 |
$13,868,974 |
$13,771,244 |
$12,941,599 |
|
3rd Lien-Post Capitalized Interest |
$0 |
$0 |
$0 |
$0 |
$0 |
$0 |
|
Total Debt Service |
$58,496,172 |
$57,992,707 |
$57,582,194 |
$61,292,004 |
$60,857,907 |
$59,667,992 |
|
|
|
|
|
|
|
|
|
Net Cash Flow After Debt Service |
($36,645,161) |
($36,988,942) |
($37,302,672) |
($39,850,953) |
($40,187,009) |
($39,806,353) |
|
|
|
|
|
|
|
|
|
Net Cash Flow Compared to Plan |
($59,798,143) |
($59,945,889) |
($60,096,227) |
($64,113,714) |
($64,273,702) |
($64,436,448) |
|
Accumulated Difference |
($1,023,516,768) |
($1,083,462,657) |
($1,143,558,884) |
($1,207,672,598) |
($1,271,946,300) |
($1,336,382,748) |
|
|
|
|
|
|
|
|
|
Reserves and Funds: Planned |
|
|
|
|
|
|
|
Debt Service Reserves |
$54,606,712 |
$54,606,712 |
$54,606,712 |
$54,606,712 |
$54,606,712 |
$54,606,712 |
|
General Fund |
$50,000,000 |
$50,000,000 |
$50,000,000 |
$50,000,000 |
$50,000,000 |
$50,000,000 |
|
Total |
$104,606,712 |
$104,606,712 |
$104,606,712 |
$104,606,712 |
$104,606,712 |
$104,606,712 |
|
|
|
|
|
|
|
|
|
Reserves & Funds + Accumulated Difference |
($918,910,056) |
($978,855,945) |
($1,038,952,172) |
($1,103,065,886) |
($1,167,339,588) |
($1,231,776,036) |
|
|
|
|
|
|
|
|
|
SOURCES & USES OF FUNDS |
2033 |
2034 |
2035 |
|
|
|
|
Annual Ridership |
9,715,395 |
9,739,872 |
9,763,935 |
|
|
|
|
Fare |
$5.00 |
$5.00 |
$5.00 |
|
|
|
|
|
|
|
|
|
|
|
|
Sources of Funds |
|
|
|
|
|
|
|
Fare Revenue |
$48,576,975 |
$48,699,362 |
$54,811,335 |
|
|
|
|
Advertising |
$15,777,206 |
$16,250,522 |
$16,738,038 |
|
|
|
|
Interest & Reserve Fund Earnings |
$5,276,403 |
$5,276,403 |
$59,883,184 |
|
|
|
|
Total Sources of Funds |
$69,630,584 |
$70,226,287 |
$131,432,557 |
|
|
|
|
|
|
|
|
|
|
|
|
Uses of Funds |
|
|
|
|
|
|
|
Operations/Maintenance/Replacement |
$31,170,774 |
$32,269,812 |
$33,237,906 |
|
|
|
|
LLC Management & Oversight |
$12,136,312 |
$12,500,402 |
$12,875,414 |
|
|
|
|
Business License Fee |
$523,453 |
$516,894 |
$1,424,761 |
|
|
|
|
Property Tax |
$4,735,606 |
$4,877,674 |
$5,024,004 |
|
|
|
|
Total Uses Before Debt Service |
$48,566,145 |
$50,164,782 |
$52,562,085 |
|
|
|
|
|
|
|
|
|
|
|
|
Net Cash Flow Before Debt Service |
$21,064,439 |
$20,061,505 |
$78,870,471 |
|
|
|
|
|
|
|
|
|
|
|
|
Debt Service (Net) |
|
|
|
|
|
|
|
1st Lien-Post Capitalized Interest |
$49,191,823 |
$48,575,563 |
$53,429,155 |
|
|
|
|
2nd Lien-Post Capitalized Interest |
$14,212,994 |
$14,031,875 |
$16,481,850 |
|
|
|
|
3rd Lien-Post Capitalized Interest |
$0 |
$0 |
$0 |
|
|
|
|
Total Debt Service |
$63,404,817 |
$62,607,438 |
$69,911,005 |
|
|
|
|
|
|
|
|
|
|
|
|
Net Cash Flow After Debt Service |
($42,340,378) |
($42,545,933) |
$8,959,466 |
|
|
|
|
|
|
|
|
|
|
|
|
Net Cash Flow Compared to Plan |
($68,513,025) |
($68,390,638) |
($62,278,665) |
|
|
|
|
Accumulated Difference |
($1,404,895,773) |
($1,473,286,411) |
($1,535,565,077) |
|
|
|
|
|
|
|
|
|
|
|
|
Reserves and Funds: Planned |
|
|
|
|
|
|
|
Debt Service Reserves |
$54,606,712 |
$54,606,712 |
$0 |
|
|
|
|
General Fund |
$50,000,000 |
$50,000,000 |
$50,000,000 |
|
|
|
|
Total |
$104,606,712 |
$104,606,712 |
$50,000,000 |
|
|
|
|
|
|
|
|
|
|
|
|
Reserves & Funds + Accumulated Difference |
($1,300,289,061) |
($1,368,679,699) |
($1,485,565,077) |
|
|
|
|
|
|
|
|
|
|
|
|
Table # A-6 |
|
LLC MONORAIL |
|
OPERATING COST ANALYSIS |
|
Revised: Conservative Ridership Projection (#3) |
|
Fiscal Year Ended 12/31 |
|
SOURCES & USES OF FUNDS |
2003 |
2004 |
2005 |
2006 |
2007 |
2008 |
|
Ridership |
1,494,501 |
6,102,323 |
6,226,956 |
6,122,861 |
6,242,762 |
6,362,663 |
|
Fare |
$2.50 |
$2.50 |
$2.50 |
$2.75 |
$2.75 |
$2.75 |
|
|
|
|
|
|
|
|
|
Sources of Funds |
|
|
|
|
|
|
|
Fare Revenue |
$3,736,252 |
$15,255,808 |
$15,567,390 |
$16,837,866 |
$17,167,595 |
$17,497,324 |
|
Advertising |
$812,500 |
$3,347,500 |
$3,447,925 |
$3,551,363 |
$3,657,904 |
$3,767,641 |
|
Interest & Reserve Fund Earnings |
$988,355 |
$5,079,469 |
$5,276,403 |
$5,276,403 |
$5,276,403 |
$5,276,403 |
|
Total Sources of Funds |
$5,537,107 |
$23,682,777 |
$24,291,718 |
$25,665,632 |
$26,101,902 |
$26,541,368 |
|
|
|
|
|
|
|
|
|
Uses of Funds |
|
|
|
|
|
|
|
Operations/Maintenance/Replacement |
$6,941,909 |
$14,300,332 |
$14,729,342 |
$15,171,222 |
$15,626,359 |
$16,321,446 |
|
LLC Management & Oversight |
$5,101,000 |
$5,150,000 |
$5,304,500 |
$5,463,635 |
$5,627,544 |
$5,796,370 |
|
Business License Fee |
$50,000 |
$584,977 |
$218,008 |
$245,590 |
$249,074 |
$251,410 |
|
Property Tax |
$1,951,007 |
$2,009,537 |
$2,069,823 |
$2,131,918 |
$2,195,876 |
$2,261,752 |
|
Total Uses Before Debt Service |
$14,043,916 |
$22,044,846 |
$22,321,673 |
$23,012,365 |
$23,698,853 |
$24,630,978 |
|
|
|
|
|
|
|
|
|
Net Cash Flow Before Debt Service |
($8,506,809) |
$1,637,931 |
$1,970,045 |
$2,653,267 |
$2,403,049 |
$1,910,390 |
|
|
|
|
|
|
|
|
|
Debt Service (Net) |
|
|
|
|
|
|
|
1st Lien-Post Capitalized Interest |
$0 |
$5,689,685 |
$23,178,739 |
$26,108,739 |
$26,478,739 |
$26,728,763 |
|
2nd Lien-Post Capitalized Interest |
$0 |
$1,658,248 |
$6,947,993 |
$7,827,993 |
$7,937,993 |
$8,007,993 |
|
3rd Lien-Post Capitalized Interest |
$0 |
$0 |
$0 |
$0 |
$0 |
$0 |
|
Total Debt Service |
$0 |
$7,347,933 |
$30,126,732 |
$33,936,732 |
$34,416,732 |
$34,736,756 |
|
|
|
|
|
|
|
|
|
Net Cash Flow After Debt Service |
($8,506,809) |
($5,710,002) |
($28,156,687) |
($31,283,465) |
($32,013,683) |
($32,826,366) |
|
|
|
|
|
|
|
|
|
Net Cash Flow Compared to Plan |
($9,668,581) |
($38,231,722) |
($39,057,066) |
($43,562,948) |
($44,467,387) |
($45,396,835) |
|
Accumulated Difference |
($9,668,581) |
($47,900,303) |
($86,957,369) |
($130,520,317) |
($174,987,704) |
($220,384,539) |
|
|
|
|
|
|
|
|
|
Reserves and Funds: Planned |
|
|
|
|
|
|
|
Debt Service Reserves |
$54,606,712 |
$54,606,712 |
$54,606,712 |
$54,606,712 |
$54,606,712 |
$54,606,712 |
|
General Fund |
$24,687,574 |
$50,000,000 |
$50,000,000 |
$50,000,000 |
$50,000,000 |
$50,000,000 |
|
Total |
$79,294,286 |
$104,606,712 |
$104,606,712 |
$104,606,712 |
$104,606,712 |
$104,606,712 |
|
|
|
|
|
|
|
|
|
Reserves & Funds + Accumulated Difference |
$69,625,705 |
$56,706,409 |
$17,649,343 |
($25,913,605) |
($70,380,992) |
($115,777,827) |
|
|
|
|
|
|
|
|
|
SOURCES & USES OF FUNDS |
2009 |
2010 |
2011 |
2012 |
2013 |
2014 |
|
Ridership |
6,270,500 |
6,386,582 |
6,418,482 |
6,257,077 |
6,288,432 |
6,320,076 |
|
Fare |
$3.00 |
$3.00 |
$3.00 |
$3.25 |
$3.25 |
$3.25 |
|
|
|
|
|
|
|
|
|
Sources of Funds |
|
|
|
|
|
|
|
Fare Revenue |
$18,811,499 |
$19,159,745 |
$19,255,447 |
$20,335,499 |
$20,437,405 |
$20,540,247 |
|
Advertising |
$3,880,670 |
$3,997,090 |
$4,117,003 |
$4,240,513 |
$4,367,728 |
$4,498,760 |
|
Interest & Reserve Fund Earnings |
$5,276,403 |
$5,276,403 |
$5,276,403 |
$5,276,403 |
$5,276,403 |
$5,276,403 |
|
Total Sources of Funds |
$27,968,572 |
$28,433,238 |
$28,648,852 |
$29,852,415 |
$30,081,537 |
$30,315,410 |
|
|
|
|
|
|
|
|
|
Uses of Funds |
|
|
|
|
|
|
|
Operations/Maintenance/Replacement |
$16,811,089 |
$17,315,422 |
$17,834,885 |
$18,369,931 |
$18,985,645 |
$19,555,214 |
|
LLC Management & Oversight |
$5,970,261 |
$6,149,369 |
$6,333,850 |
$6,523,866 |
$6,719,582 |
$6,921,169 |
|
Business License Fee |
$280,889 |
$97,739 |
$97,447 |
$106,510 |
$106,056 |
$105,792 |
|
Property Tax |
$2,329,604 |
$2,399,493 |
$2,471,477 |
$2,545,622 |
$2,621,990 |
$2,700,650 |
|
Total Uses Before Debt Service |
$25,391,844 |
$25,962,023 |
$26,737,659 |
$27,545,929 |
$28,433,273 |
$29,282,825 |
|
|
|
|
|
|
|
|
|
Net Cash Flow Before Debt Service |
$2,576,728 |
$2,471,216 |
$1,911,193 |
$2,306,486 |
$1,648,264 |
$1,032,585 |
|
|
|
|
|
|
|
|
|
Debt Service (Net) |
|
|
|
|
|
|
|
1st Lien-Post Capitalized Interest |
$29,863,739 |
$30,368,739 |
$30,273,739 |
$33,093,739 |
$32,963,739 |
$32,863,739 |
|
2nd Lien-Post Capitalized Interest |
$8,952,993 |
$9,097,993 |
$9,072,993 |
$9,387,993 |
$9,352,993 |
$9,322,993 |
|
3rd Lien-Post Capitalized Interest |
$0 |
$9,395,000 |
$9,365,000 |
$10,765,000 |
$10,730,000 |
$10,695,000 |
|
Total Debt Service |
$38,816,732 |
$48,861,732 |
$48,711,732 |
$53,246,732 |
$53,046,732 |
$52,881,732 |
|
|
|
|
|
|
|
|
|
Net Cash Flow After Debt Service |
($36,240,004) |
($46,390,516) |
($46,800,539) |
($50,940,246) |
($51,398,468) |
($51,849,147) |
|
|
|
|
|
|
|
|
|
Net Cash Flow Compared to Plan |
($50,284,452) |
($51,277,474) |
($51,672,909) |
($56,265,758) |
($56,701,291) |
($57,138,760) |
|
Accumulated Difference |
($270,668,991) |
($321,946,465) |
($373,619,374) |
($429,885,132) |
($486,586,422) |
($543,725,182) |
|
|
|
|
|
|
|
|
|
Reserves and Funds: Planned |
|
|
|
|
|
|
|
Debt Service Reserves |
$54,606,712 |
$54,606,712 |
$54,606,712 |
$54,606,712 |
$54,606,712 |
$54,606,712 |
|
General Fund |
$50,000,000 |
$50,000,000 |
$50,000,000 |
$50,000,000 |
$50,000,000 |
$50,000,000 |
|
Total |
$104,606,712 |
$104,606,712 |
$104,606,712 |
$104,606,712 |
$104,606,712 |
$104,606,712 |
|
|
|
|
|
|
|
|
|
Reserves & Funds + Accumulated Difference |
($166,062,279) |
($217,339,753) |
($269,012,662) |
($325,278,420) |
($381,979,710) |
($439,118,470) |
|
|
|
|
|
|
|
|
|
SOURCES & USES OF FUNDS |
2015 |
2016 |
2017 |
2018 |
2019 |
2020 |
|
Ridership |
6,175,784 |
6,206,644 |
6,237,786 |
6,107,772 |
6,138,448 |
6,169,124 |
|
Fare |
$3.50 |
$3.50 |
$3.50 |
$3.75 |
$3.75 |
$3.75 |
|
|
|
|
|
|
|
|
|
Sources of Funds |
|
|
|
|
|
|
|
Fare Revenue |
$21,615,243 |
$21,723,256 |
$21,832,250 |
$22,904,147 |
$23,019,181 |
$23,134,215 |
|
Advertising |
$4,633,723 |
$4,772,735 |
$4,915,917 |
$5,063,394 |
$5,215,296 |
$5,371,755 |
|
Interest & Reserve Fund Earnings |
$5,276,403 |
$5,276,403 |
$5,276,403 |
$5,276,403 |
$5,276,403 |
$5,276,403 |
|
Total Sources of Funds |
$31,525,369 |
$31,772,393 |
$32,024,570 |
$33,243,944 |
$33,510,880 |
$33,782,373 |
|
|
|
|
|
|
|
|
|
Uses of Funds |
|
|
|
|
|
|
|
Operations/Maintenance/Replacement |
$20,141,870 |
$20,746,127 |
$21,368,510 |
$22,020,427 |
$22,681,040 |
$23,361,471 |
|
LLC Management & Oversight |
$7,128,804 |
$7,342,669 |
$7,562,949 |
$7,789,837 |
$8,023,532 |
$8,264,238 |
|
Business License Fee |
$115,027 |
$114,862 |
$114,325 |
$123,695 |
$123,369 |
$122,971 |
|
Property Tax |
$2,781,669 |
$2,865,120 |
$2,951,073 |
$3,039,605 |
$3,130,793 |
$3,224,717 |
|
Total Uses Before Debt Service |
$30,167,371 |
$31,068,777 |
$31,996,857 |
$32,973,564 |
$33,958,735 |
$34,973,397 |
|
|
|
|
|
|
|
|
|
Net Cash Flow Before Debt Service |
$1,357,998 |
$703,616 |
$27,712 |
$270,379 |
($447,855) |
($1,191,025) |
|
|
|
|
|
|
|
|
|
Debt Service (Net) |
|
|
|
|
|
|
|
1st Lien-Post Capitalized Interest |
$35,393,739 |
$35,293,739 |
$35,183,739 |
$38,083,739 |
$37,973,739 |
$37,848,739 |
|
2nd Lien-Post Capitalized Interest |
$10,477,933 |
$10,447,993 |
$10,412,993 |
$11,272,993 |
$11,237,993 |
$11,202,993 |
|
3rd Lien-Post Capitalized Interest |
$11,630,000 |
$11,595,000 |
$11,560,000 |
$12,515,000 |
$12,475,000 |
$12,435,000 |
|
Total Debt Service |
$57,501,672 |
$57,336,732 |
$57,156,732 |
$61,871,732 |
$61,686,732 |
$61,486,732 |
|
|
|
|
|
|
|
|
|
Net Cash Flow After Debt Service |
($56,143,674) |
($56,633,116) |
($57,129,020) |
($61,601,353) |
($62,134,587) |
($62,677,757) |
|
|
|
|
|
|
|
|
|
Net Cash Flow Compared to Plan |
($61,895,059) |
($62,365,990) |
($62,845,259) |
($67,786,105) |
($68,303,028) |
($68,826,310) |
|
Accumulated Difference |
($605,620,241) |
($667,986,231) |
($730,831,490) |
($798,617,594) |
($866,920,622) |
($935,746,932) |
|
|
|
|
|
|
|
|
|
Reserves and Funds: Planned |
|
|
|
|
|
|
|
Debt Service Reserves |
$54,606,712 |
$54,606,712 |
$54,606,712 |
$54,606,712 |
$54,606,712 |
$54,606,712 |
|
General Fund |
$50,000,000 |
$50,000,000 |
$50,000,000 |
$50,000,000 |
$50,000,000 |
$50,000,000 |
|
Total |
$104,606,712 |
$104,606,712 |
$104,606,712 |
$104,606,712 |
$104,606,712 |
$104,606,712 |
|
|
|
|
|
|
|
|
|
Reserves & Funds + Accumulated Difference |
($501,013,529) |
($563,379,519) |
($626,224,778) |
($694,010,882) |
($762,313,910) |
($831,140,220) |
|
|
|
|
|
|
|
|
|
SOURCES & USES OF FUNDS |
2021 |
2022 |
2023 |
2024 |
2025 |
2026 |
|
Ridership |
6,051,170 |
6,081,407 |
6,111,912 |
5,989,303 |
6,004,213 |
6,019,122 |
|
Fare |
$4.00 |
$4.00 |
$4.00 |
$4.25 |
$4.25 |
$4.25 |
|
|
|
|
|
|
|
|
|
Sources of Funds |
|
|
|
|
|
|
|
Fare Revenue |
$24,204,682 |
$24,325,630 |
$24,447,649 |
$25,454,539 |
$25,517,903 |
$25,581,267 |
|
Advertising |
$5,532,907 |
$5,698,895 |
$5,869,862 |
$6,045,957 |
$6,227,336 |
$6,414,156 |
|
Interest & Reserve Fund Earnings |
$5,276,403 |
$5,276,403 |
$5,276,403 |
$5,276,403 |
$5,276,403 |
$5,276,403 |
|
Total Sources of Funds |
$35,013,992 |
$35,300,928 |
$35,593,913 |
$36,776,900 |
$37,021,642 |
$37,271,826 |
|
|
|
|
|
|
|
|
|
Uses of Funds |
|
|
|
|
|
|
|
Operations/Maintenance/Replacement |
$24,062,315 |
$24,784,185 |
$25,471,700 |
$26,235,851 |
$27,022,927 |
$27,833,614 |
|
LLC Management & Oversight |
$8,512,165 |
$8,767,530 |
$9,030,556 |
$9,301,473 |
$9,580,517 |
$9,867,933 |
|
Business License Fee |
$132,608 |
$372,368 |
$397,118 |
$439,341 |
$436,528 |
$433,652 |
|
Property Tax |
$3,321,459 |
$3,421,103 |
$3,523,736 |
$3,629,448 |
$3,738,331 |
$3,850,481 |
|
Total Uses Before Debt Service |
$36,028,547 |
$37,345,185 |
$38,423,110 |
$39,606,113 |
$40,778,303 |
$41,985,680 |
|
|
|
|
|
|
|
|
|
Net Cash Flow Before Debt Service |
($1,014,555) |
($2,044,258) |
($2,829,197) |
($2,829,213) |
($3,756,661) |
($4,713,854) |
|
|
|
|
|
|
|
|
|
Debt Service (Net) |
|
|
|
|
|
|
|
1st Lien-Post Capitalized Interest |
$40,828,739 |
$40,578,739 |
$40,443,739 |
$40,348,739 |
$42,663,739 |
$42,379,663 |
|
2nd Lien-Post Capitalized Interest |
$12,082,993 |
$11,992,993 |
$11,972,993 |
$12,147,993 |
$12,477,993 |
$12,387,993 |
|
3rd Lien-Post Capitalized Interest |
$13,415,000 |
$1,300,000 |
$0 |
$0 |
$0 |
$0 |
|
Total Debt Service |
$66,326,732 |
$53,871,732 |
$52,416,732 |
$52,496,732 |
$55,141,732 |
$54,767,656 |
|
|
|
|
|
|
|
|
|
Net Cash Flow After Debt Service |
($67,341,287) |
($55,915,990) |
($55,245,929) |
($55,325,945) |
($58,898,393) |
($59,481,510) |
|
|
|
|
|
|
|
|
|
Net Cash Flow Compared to Plan |
($73,971,709) |
($74,534,372) |
($75,101,822) |
($80,292,995) |
($80,724,813) |
($81,164,218) |
|
Accumulated Difference |
($1,009,718,641) |
($1,084,253,014) |
($1,159,354,835) |
($1,239,647,831) |
($1,320,372,643) |
($1,401,536,861) |
|
|
|
|
|
|
|
|
|
Reserves and Funds: Planned |
|
|
|
|
|
|
|
Debt Service Reserves |
$54,606,712 |
$54,606,712 |
$54,606,712 |
$54,606,712 |
$54,606,712 |
$54,606,712 |
|
General Fund |
$50,000,000 |
$50,000,000 |
$50,000,000 |
$50,000,000 |
$50,000,000 |
$50,000,000 |
|
Total |
$104,606,712 |
$104,606,712 |
$104,606,712 |
$104,606,712 |
$104,606,712 |
$104,606,712 |
|
|
|
|
|
|
|
|
|
Reserves & Funds + Accumulated Difference |
($905,111,929) |
($979,646,302) |
($1,054,748,123) |
($1,135,041,119) |
($1,215,765,931) |
($1,296,930,149) |
|
|
|
|
|
|
|
|
|
SOURCES & USES OF FUNDS |
2027 |
2028 |
2029 |
2030 |
2031 |
2032 |
|
Ridership |
5,906,507 |
5,921,101 |
5,935,950 |
5,831,784 |
5,846,336 |
5,861,140 |
|
Fare |
$4.50 |
$4.50 |
$4.50 |
$4.75 |
$4.75 |
$4.75 |
|
|
|
|
|
|
|
|
|
Sources of Funds |
|
|
|
|
|
|
|
Fare Revenue |
$26,579,283 |
$26,644,954 |
$26,711,777 |
$27,700,973 |
$27,770,098 |
$27,840,414 |
|
Advertising |
$6,606,581 |
$6,804,778 |
$7,008,922 |
$7,219,189 |
$7,435,765 |
$7,658,838 |
|
Interest & Reserve Fund Earnings |
$5,276,403 |
$5,276,403 |
$5,276,403 |
$5,276,403 |
$5,276,403 |
$5,276,403 |
|
Total Sources of Funds |
$38,462,267 |
$38,726,135 |
$38,997,101 |
$40,196,565 |
$40,482,265 |
$40,775,655 |
|
|
|
|
|
|
|
|
|
Uses of Funds |
|
|
|
|
|
|
|
Operations/Maintenance/Replacement |
$28,668,623 |
$29,694,281 |
$30,585,110 |
$31,502,663 |
$32,447,743 |
$33,421,175 |
|
LLC Management & Oversight |
$10,163,971 |
$10,468,890 |
$10,782,956 |
$11,106,445 |
$11,439,638 |
$11,782,828 |
|
Business License Fee |
$463,060 |
$459,139 |
$455,871 |
$485,286 |
$481,734 |
$492,602 |
|
Property Tax |
$3,965,996 |
$4,084,975 |
$4,207,525 |
$4,333,750 |
$4,463,763 |
$4,597,676 |
|
Total Uses Before Debt Service |
$43,261,649 |
$44,707,285 |
$46,031,461 |
$47,428,144 |
$48,832,878 |
$50,294,280 |
|
|
|
|
|
|
|
|
|
Net Cash Flow Before Debt Service |
($4,799,382) |
($5,981,150) |
($7,034,360) |
($7,231,579) |
($8,350,612) |
($9,518,626) |
|
|
|
|
|
|
|
|
|
Debt Service (Net) |
|
|
|
|
|
|
|
1st Lien-Post Capitalized Interest |
$45,262,468 |
$44,872,348 |
$44,555,710 |
$47,423,030 |
$47,086,663 |
$46,726,393 |
|
2nd Lien-Post Capitalized Interest |
$13,233,704 |
$13,120,359 |
$13,026,484 |
$13,868,974 |
$13,771,244 |
$12,941,599 |
|
3rd Lien-Post Capitalized Interest |
$0 |
$0 |
$0 |
$0 |
$0 |
$0 |
|
Total Debt Service |
$58,496,172 |
$57,992,707 |
$57,582,194 |
$61,292,004 |
$60,857,907 |
$59,667,992 |
|
|
|
|
|
|
|
|
|
Net Cash Flow After Debt Service |
($63,295,554) |
($63,973,857) |
($64,616,554) |
($68,523,583) |
($69,208,519) |
($69,186,618) |
|
|
|
|
|
|
|
|
|
Net Cash Flow Compared to Plan |
($86,448,536) |
($86,930,804) |
($87,410,110) |
($92,786,344) |
($93,295,212) |
($93,816,713) |
|
Accumulated Difference |
($1,487,985,397) |
($1,574,916,201) |
($1,662,326,311) |
($1,755,112,655) |
($1,848,407,867) |
($1,942,224,580) |
|
|
|
|
|
|
|
|
|
Reserves and Funds: Planned |
|
|
|
|
|
|
|
Debt Service Reserves |
$54,606,712 |
$54,606,712 |
$54,606,712 |
$54,606,712 |
$54,606,712 |
$54,606,712 |
|
General Fund |
$50,000,000 |
$50,000,000 |
$50,000,000 |
$50,000,000 |
$50,000,000 |
$50,000,000 |
|
Total |
$104,606,712 |
$104,606,712 |
$104,606,712 |
$104,606,712 |
$104,606,712 |
$104,606,712 |
|
|
|
|
|
|
|
|
|
Reserves & Funds + Accumulated Difference |
($1,383,378,685) |
($1,470,309,489) |
($1,557,719,599) |
($1,650,505,943) |
($1,743,801,155) |
($1,837,617,868) |
|
|
|
|
|
|
|
|
|
SOURCES & USES OF FUNDS |
2033 |
2034 |
2035 |
|
|
|
|
Ridership |
5,764,363 |
5,778,886 |
5,793,163 |
|
|
|
|
Fare |
$5.00 |
$5.00 |
$5.00 |
|
|
|
|
|
|
|
|
|
|
|
|
Sources of Funds |
|
|
|
|
|
|
|
Fare Revenue |
$28,821,816 |
$28,894,431 |
$28,965,815 |
|
|
|
|
Advertising |
$7,888,603 |
$8,125,261 |
$8,369,019 |
|
|
|
|
Interest & Reserve Fund Earnings |
$5,276,403 |
$5,276,403 |
$59,883,184 |
|
|
|
|
Total Sources of Funds |
$41,986,823 |
$42,296,095 |
$97,218,018 |
|
|
|
|
|
|
|
|
|
|
|
|
Uses of Funds |
|
|
|
|
|
|
|
Operations/Maintenance/Replacement |
$34,287,851 |
$35,496,793 |
$36,561,697 |
|
|
|
|
LLC Management & Oversight |
$12,136,312 |
$12,500,402 |
$12,875,414 |
|
|
|
|
Business License Fee |
$523,453 |
$516,894 |
$1,424,761 |
|
|
|
|
Property Tax |
$4,735,606 |
$4,877,674 |
$5,024,004 |
|
|
|
|
Total Uses Before Debt Service |
$51,683,223 |
$53,391,763 |
$55,885,876 |
|
|
|
|
|
|
|
|
|
|
|
|
Net Cash Flow Before Debt Service |
($9,696,400) |
($11,095,668) |
$41,332,142 |
|
|
|
|
|
|
|
|
|
|
|
|
Debt Service (Net) |
|
|
|
|
|
|
|
1st Lien-Post Capitalized Interest |
$49,191,823 |
$48,575,563 |
$53,429,155 |
|
|
|
|
2nd Lien-Post Capitalized Interest |
$14,212,994 |
$14,031,875 |
$16,481,850 |
|
|
|
|
3rd Lien-Post Capitalized Interest |
$0 |
$0 |
$0 |
|
|
|
|
Total Debt Service |
$63,404,817 |
$62,607,438 |
$69,911,005 |
|
|
|
|
|
|
|
|
|
|
|
|
Net Cash Flow After Debt Service |
($73,101,217) |
($73,703,106) |
($28,578,863) |
|
|
|
|
|
|
|
|
|
|
|
|
Net Cash Flow Compared to Plan |
($99,273,864) |
($99,547,811) |
($99,816,995) |
|
|
|
|
Accumulated Difference |
($2,041,498,444) |
($2,141,046,256) |
($2,240,863,250) |
|
|
|
|
|
|
|
|
|
|
|
|
Reserves and Funds: Planned |
|
|
|
|
|
|
|
Debt Service Reserves |
$54,606,712 |
$54,606,712 |
$0 |
|
|
|
|
General Fund |
$50,000,000 |
$50,000,000 |
$50,000,000 |
|
|
|
|
Total |
$104,606,712 |
$104,606,712 |
$50,000,000 |
|
|
|
|
|
|
|
|
|
|
|
|
Reserves & Funds + Accumulated Difference |
($1,936,891,732) |
($2,036,439,544) |
($2,190,863,250) |
|
|
|
|
|
|
|
|
|
|
|
(c) 2000 www.publicpurpose.com --- Wendell Cox Consultancy --- Permission granted to use with attribution.
| NAVIGATION & PUBLICATION SERIES |
|

