Abstract 1
Summary of Conclusions 2
1. Introduction 9
2. Local Circulation Transit Systems 10
3. The Uniqueness of Las Vegas 10
4. US and International Ridership Projection Reliability 11
5. High Volume Projections: The Record 13
6. The LLC Monorail Ridership Projection: Optimistic Foundations 15
7. Ridership Increases to Fare Increases (Elasticity) 17
8. Comparison to the Las Vegas Strip Bus Route 18
9. LLC Monorail Ridership from the Bus 19
10. LLC Monorail Ridership Attracted from the Existing Monorail 19
11. LLC Monorail Ridership Attracted from Walking 22
12. LLC Monorail Ridership Attracted from Taxicabs 24
13. Comparison to Other Local Circulators 25
14. Fare Recovery Ratio 27
15. Hotel Generation Model 29
16. Advertising Revenues 30
17. Operating and Capital Costs 30
18. Additional Issues 32
19. Revised Ridership and Revenue Projections 33
20. Impact on Riders and Taxpayers 38
21. Issues Raised by the April 2000 Projections 39
Appendices 43
1: US Rail Systems: Annual Boardings per Route Mile
2.: Rail Systems in High Auto Use Nations
3: Fare Recovery Ratios: Major US Transit Systems
4: Cash Flow Analysis: Project Projection as Submitted
5: Cash Flow Analysis: Revised: High Projection
6. Cash Flow Analysis: Revised: Low Projection
ABSTRACT
Using available data, this study analyzes the ridership and revenue projections for
monorail proposed by MGM Grand-Bally's Monorail LC (the "LLC Monorail"). This 2d
Edition of the report contains updated information and analysis based upon new
projections provided by the project sponsors through April 2000. It is concluded that:
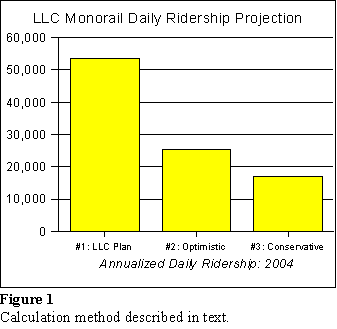
Daily ridership is likely to be in the range of 16,900 to 25,400 in 2004, compared
to the projected 53,500 (53 to 68 percent below the LLC Monorail projection).
Net cash flow over the project operating horizon (2003-2035) is likely to be in the
range of minus $1.000 billion to minus $1.705 billion. This compares to the LLC
Monorail projection of plus $534 million.
Project revenues are unlikely to be sufficient to pay project obligations during all
but two years of operation, from 2003 through 2035.
Project reserves are likely to be exceeded by accumulated cash flow deficits
beginning during 2006 or 2007. This could result in a default.
Local taxpayers, state taxpayers and riders could be at risk in three ways:
Diversion of tourist passengers from the Las Vegas Strip route to the LLC
Monorail could reduce cross-subsidies to other RTC routes, necessitating
service reductions or higher taxes.
It is intended that the LLC Monorail will be operated cooperatively with a to be
developed RTC fixed guideway from the north terminal to Cashman Field. A
financial failure on the part of the LLC Monorail could lead to circumstances
under which higher taxes might be sought to continue operation of the LLC
Monorail as a part of the RTC system.
In the event of a financial failure, the state could face higher bond interest rates,
which would raise the cost of debt to state taxpayers.
As is the case with respect to all projections, factors such as the state of the economy,
Las Vegas' uniqueness as a tourist destination and many others could generate actual
results that are above or below these forecasts.
SUMMARY OF CONCLUSIONS
This study analyzes the ridership and revenue projections for a monorail proposed by
MGM Grand-Bally's Monorail LC (the "LLC Monorail"), which will replace the current
MGM Grand to Bally's monorail and extend the route. This 2d Edition of the report
contains updated information and analysis based upon new projections provided by the
project sponsors through April 2000. Project consultants forecast that this system would
carry 53,525 daily riders in 2004 (the first full year of operation) and would earn a net
profit of nearly $534 million between 2003 and 2035. In 2003, the average fare per one
way trip would be $2.50.
The New Projections: There are substantial changes in the new information and
projections provided in 2000 by the project sponsors. The purchase price of the existing
monorail has increased 25 percent, and the fees to be charged by the management
company have increased 250 percent. The budget and staffing plan for the
management company leads to the conclusion that the four executives will be paid
nearly one-half million dollars annually in salaries and benefits. Operating expenses
have increased 44 percent. The starting average fare (2003) has been increased from
$2.00 to $2.50 and fare revenues are projected to increase 31 percent. The cost
increases are considered highly questionable and the revenue increase is considered
unachievable. Each of these changes from projections supplied in 1999 would appear
to make the project less viable financially.
The very significant revisions that have occurred in the projections between the original
submittals to the state and the latest are cause for concern. In a period of just six
months, the starting fare has been increased by 25 percent, the sale price of the
existing monorail has risen 25 percent, and the management fee has risen 250 percent.
It is inconceivable that any circumstances have changed during this short period of time
that would require adjustments of such significance. These inconsistencies could cast
doubt on the seriousness and reliableness of the analysis that produced the projections
(Section 21).
Revised Analysis: The basic conclusion of this study is that the LLC Monorail is
unlikely to achieve its ridership projections, revenue projections or financial obligations.
Specific findings are as follows:
The LLC Monorail is a local circulation system, similar in technology and function
to downtown people movers and monorails in Seattle, Miami, Jacksonville and
Detroit (Section 2).
Because of its high tourist attraction and gaming, Las Vegas is a unique
environment. Some differences will tend to be favorable toward LLC Monorail
performance, while others will not. (Section 3).
US and international ridership projections for projects similar to the LLC Monorail
have often been overly optimistic (Section 4).
The problem of inaccurate forecasts have been particularly acute with respect to
systems projected to carry high passenger volumes. On average, actual
ridership has averaged more than 70 percent below projections, with the most
favorable result being a 28 percent negative error. The LLC Monorail is projected
to be such a high volume system (Section 5).
The ridership projections for the LLC Monorail rely substantially on the
projections developed for the proposed Regional Transportation Commission
(RTC) fixed guideway system. These projections are exceedingly optimistic, at
ridership levels high among western European, North American and Australasian
systems. The RTC projections are among the most aggressive in US transit
history and could emerge as among the least accurate. The LLC Monorail is
projected to carry virtually the same or more passengers per route mile than the
New York subway, the London Underground and the Stockholm Metro, and more
than double that of the most heavily used new rail systems in the United States.
It is not likely that such an intensity of ridership would be attracted. (Section 6)
The LLC Monorail projections assume that ridership would be considerably less
sensitive to fare increases than the national experience (fare elasticity). If
ridership falls in reaction to fare increases at the national rate, while all other LLC
Monorail assumptions are preserved, the LLC Monorail would earn two-thirds
less net income from 2003 to 2035 (Section 7)
The Las Vegas Strip Bus route (#301) carries more than 10,000 tourist trips
daily. On a route mile basis the LLC Monorail is projected to carry more than four
times the ridership of the bus route (Section 8).
The LLC Monorail projects that approximately 500 riders will switch from the bus
route to the LLC Monorail. This means that more than 53,000 daily riders would
be attracted from other modes, such as the existing monorail, taxicabs and
walking. (Section 9).
The LLC Monorail is projected to attract one-third of its ridership from the existing
monorail that operates between the MGM Grand Hotel and Bally's. This is more
ridership than is currently carried on the existing monorail. Moreover, the existing
monorail charges no fare. It is likely that charging the $2.50 fare level would
reduce the potential passenger attraction from the existing monorail to between
5,300 and 7,900 daily, not the 18,000 used in the LLC Monorail projections
(Section 10).(1)
The LLC Monorail is projected to attract one-third of its ridership from walking
trips. However, the LLC Monorail would provide little or no travel time advantage
for most walking trips. Further, walking is not simply a method of traveling from
an origin to a destination. The Las Vegas Strip is one of the most visually
stimulating street scapes in the world, which is an important reason why walking
is the most popular mode of travel among Las Vegas Strip visitors (Section 11).
The LLC Monorail is projected to attract 20 percent of its ridership from taxicabs.
This seems highly optimistic, because the LLC Monorail will provide virtually no
travel time advantage. Moreover, taxicab users tend to be less price sensitive
and are not likely to be attracted by the lower LLC Monorail fares (Section 12).
The LLC Monorail is projected to have daily ridership far above the levels
achieved by other local circulator systems in two-dimensional(2) dense downtown
areas, despite charging a much higher average fare. This is not likely to be
achievable (Section 13).
The LLC Monorail is projected to have a fare recovery ratio (fare revenues
divided by operating costs exclusive of debt service and taxes(3)) that is 280
percent of any other transit system in the United States and nine times average.
This seems optimistic (Section 14).
According to the LLC Monorail Ridership and Revenue Study, there is a
correlation between the number of hotel rooms and existing monorail ridership.
Based upon the higher number of rooms that will be in hotels adjacent to LLC
Monorail stations the daily ridership potential is approximately 34 percent lower
than projected, assuming a $0.00 fare. The $2.50 average fare is expected to
reduce ridership demand (Section 15).
Advertising revenues appear to be exceedingly high and could be 50 percent to
90 percent lower than projected. A 50 percent reduction in advertising revenue
would reduce net cash flow nearly one-half between 2003 and 2035 (Section
16).
As in the case of ridership projections, both US and international capital and
operating cost projections have often been unreliable. Such cost overruns could
have a negative impact on the financial performance of the LLC Monorail project.
(Section 17).
Additional issues include a potential delay to comply with federal environmental
regulations due to possible project integration with the RTC fixed guideway
system and the potential for competition should a continuous monorail (or more
continuous monorails) be developed on the west side of the Las Vegas Strip
(Section 18).
Based upon the analysis above, two alternative projections were prepared and
compared to the projections supplied by the LLC Monorail proponents. Both
Projection #2 and Projection #3 are substantially below the Proponent's
Projection (#1). The principal reason for the differences is that the proponent's
consultants have considerably lower fare elasticity factors and made far more
optimistic assumptions for the ridership level that would be attracted at the
comparatively high average starting fare.
Projection #1, the Proponent's Projection, is as supplied by the LLC
Monorail project sponsors.
Projection #2, the Optimistic Ridership Projection, adjusted for the
impact of the $2.50 average fare using the LLC Monorail fare elasticity
factor of -0.20., This projection accepts all other LLC Monorail
assumptions, including the aggressive advertising revenue projection and
the LLC Monorail fare elasticity factor for subsequent fare increases
between 2003 and 2034. Projection #1 assumes no capital or operating
cost overrun. This projection yields 25,400 daily passengers in 2004, 53
percent below the 53,500 LLC Monorail projection. Between 2003 and
2035, a net negative cash flow of 36 percent (minus $1.000 billion) would
occur. Compared to the Proponent's Projections (#1), a negative cash
flow result of $1.5 billion would occur. Revenues would be insufficient to
pay obligations for all but two years from 2003 to 2035. The projected
accumulated would be greater than debt service reserves and the general
fund from 2007.
Projection #3, the Conservative Ridership Projection, is considered to
be the most likely scenario. Projection #3 adjusts for the impact of the
$2.50 fare, using the national -0.36 fare elasticity factor. This projection
downwardly adjusts advertising revenues, uses the national fare elasticity
factor for fare increases between 2003 and 2035, and assumes a 10
percent operating cost overrun. Projection #2 assumes no capital cost
overrun. Between 2003 and 2035, a net loss of 60 percent ($1.705 billion)
would occur. Compared to the Proponent's Projections (#1), a negative
cash flow result of $2.2 billion would occur. Revenues would be
insufficient to pay obligations in all years from 2003 to 2035. The
projected accumulated would be greater than debt service reserves and
the general fund from 2006 (Figure #1 and Table).