TRANSIT SERVICES: DENVER EXPERIENCE Presented at the 76th Annual Meeting of the Transportation Research Board Washington January 13, 1997 and the 5th International Conference on Competition and Ownership in Passenger Transport Leeds May 29, 1997 By Wendell Cox, Wendell Cox Consultancy (St. Louis), Janet E. Kraus, Mundle & Associates, Inc. (Philadelphia) Subhash R. Mundle, Mundle & Associates, Inc. (Philadelphia)
The Regional Transportation District (RTD) in Denver, Colorado has contracted a
substantial portion of its fixed-route bus service in response to state legislation
enacted in May 1988. By 1994, RTD was operating 24.6 percent of its bus service
through competitive contracts. The first contracts took effect in 1989. Services bid
in 1992 and 1994 included a provision that the contractors provide buses that RTD
could purchase at the end of the contract period.
A review of this program was conducted in 1995, approximately five years after the start of the program. This paper presents the results of this review, with primary emphasis on the financial impacts of competitive contracting on the transit system. Based on this analysis, it has been estimated that RTD will have saved $88.0 million dollars between 1989 and 1999 as a result of competitive contracting. Similarly, RTD's cost efficiency, measured as the operating cost per hour, has improved significantly during the six-year period from 1988 to 1994. At the same time, RTD increased service levels by more than 15 percent, essentially using the savings from competitive contracting. However, RTD's decision to have the contractors provide the buses, at its option, has cost RTD $15.8 million more than if it had purchased the buses directly. This is attributable to pre-paid capital charges from the post-contract period, financing charges, profit margin, and fees and taxes from which RTD is exempt.
Key Words:
ACKNOWLEDGMENT The results presented in this paper are based on a Management/Administration
Study conducted for the Regional Transportation District (RTD) in Denver,
Colorado. The authors wish to acknowledge the guidance and support provided by
Clarence W. Marsella, General Manager of RTD. The results presented in this
paper reflect the opinions of the authors.
DENVER EXPERIENCE
INTRODUCTION
Senate Bill 164, enacted in May 1988, required the Regional Transportation District
(RTD) in Denver, Colorado to competitively contract at least 20 percent of its bus
service. The purpose of SB 164 was to produce public transit service at the lowest
possible cost consistent with service and safety standards. SB 164 authorized RTD
to use a mix of public and private resources to achieve its purpose. In response to
this legislative request, RTD began to contract for transit services in June 1989.
RTD has exceeded the 20 percent legislative requirement. By 1994, RTD was operating 24.6 percent of its bus service through competitive contracts. RTD implemented its competitive contracting for services over time, in groups and packages. The contract packages are listed in Table 1. In the earlier years of the program, RTD used two approaches regarding the vehicles needed for the service: either the contractor used vehicles provided by RTD or the contractor provided its own vehicles. In all but one of the later groups, RTD decided to have the contractors provide the buses with RTD retaining an option to purchase the buses. Contractors were required to provide new buses for the service. RTD-provided vehicles were used buses.
A review of RTD's competitive contracting program was conducted in 1995, approximately five
years after the start of the program. This paper presents the results of this
review, with primary emphasis on the financial impacts of competitive contracting
on the transit system. It discusses both operating cost impacts and the
consequences of RTD's decision to purchase buses through contractors.
PROGRAM ADMINISTRATION
RTD has implemented the requirements of SB 164 successfully. RTD maintains a number of quality of service and safety-related performance indicators for its competitively contracted and directly-operated services. As shown in Table 2, the services it has obtained from the competitive market achieved better performance levels in some categories and worse performance levels in other categories compared to RTD's directly-operated services. The indicators presented in Table 2 were developed from a database maintained by the RTD for directly-operated and competitively-contracted services. Therefore, the definitions of the indicators and the data collection methods were identical. For the year ending September 30, 1995, for example, the performance of the competitively-contracted service has been better than the directly-operated services in the areas of vehicle accidents, passenger accidents, and on-time performance. The competitively-contracted service has been worse than RTD's directly-operated services during this time period in the areas of complaints, commendations, and miles between road calls.
RTD has maintained full policy control over the contracted services. It defines the services to
be operated and monitors contractor performance. RTD's contract management
practices have produced a satisfactory performance level from the contractors.
All contracts have remained in effect for the full period of performance. No
contracts have been terminated. Nor has there been a need to consider
termination action in response to inadequate performance by a contractor.
COST IMPACTS
RTD's competitive contracting program includes two cost components: operating costs, which are incurred in lieu of RTD's costs for directly operating the
service, and capital-related costs, which include the costs incurred by the contractors in acquiring buses to provide the service (i.e., the purchase price for the
buses, purchase taxes, license fees, financing charges, and attributable profit
margins). When RTD supplies the vehicles, there are no bus acquisition costs
associated with the contract.
Initially, RTD's competitive contracts required either RTD-supplied buses or private operator-supplied vehicles. Later contracts (Groups VI and VII) required contractors to
supply the vehicles. Further, contractors were required to supply new buses,
which RTD would have an option to buy at a later date.
For this analysis, in order to "level the playing field" to compare contractor costs with RTD
directly-operated services, the operating and capital-related cost components
were separated. This break-out was done based on information presented by
the contractors in their bid packages, supplemented by discussions with RTD
and contractor personnel. In-house operating costs were developed through the
application of a cost allocation model developed for RTD by KPMG Peat
Marwick(1,2,3). This fully-allocated cost model addressed the specific unit
costs of different types of RTD services. This was accomplished by distinguishing labor productivity and other unit cost factors for peak and off-peak
services. Maintenance costs were distinguished by a differential for the types of
buses operated from RTD's various garages. The model also separated costs
for "retained functions", which included the functions that RTD continued to
provide regardless of who operated the route. Examples of retained functions
include: governance board, legal counsel, mall security, marketing, scheduling,
planning, street supervision, and grants management.
Operating Cost Impacts
RTD has benefited from two types of operating cost impacts from its competitive contracting program in response to SB 164:
The following two sections discuss these direct and indirect impacts on operating costs.
Direct Impact of Competitively Contracted Service
To determine the direct costs impacts, a comparison was made of the annual
operating costs for contractor-provided services and the operating costs that
would have been incurred had RTD provided the same services in-house. The
contractors' operating costs are based on their bid costs less capital-related
costs. RTD's operating costs include only incremental costs and are based on
the KPMG cost allocation model.
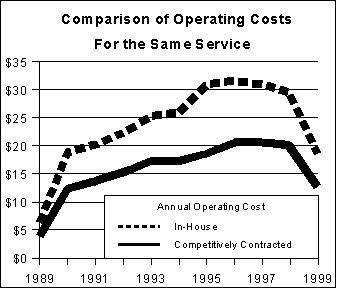
The results of this comparison are presented in the figure Comparison of Operating
Costs for the Same Service. In 1994, for example, the operating cost for contractor-provided service was $17.3 million. Had
RTD operated that service in-house, the cost for the same level of service is
estimated to be $26.0 million. Over the eleven-year period from 1989 to 1999,
the cumulative operating costs for competitively contracted service is estimated
to be $172.4 million. RTD's incremental in-house operating costs for the same
service over the same time period is estimated to be $260.4 million. Thus,
competitive contracting is estimated to reduce RTD's operating expenses over
this time period by $88.0 million. RTD already has benefited from these savings.
It saved $51.5 million from the contracted services operated from 1989 to 1995.
The balance of the savings ($36.5 million) will be achieved from existing
contracts from 1996 to 1999. This assumes that all currently contracted packages will be operated through 1999.
Indirect Impacts on Cost Efficiency and Service Levels
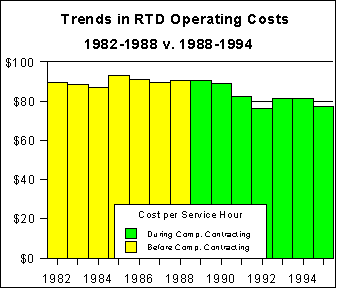
The indirect impacts of competitive contracting on RTD's cost efficiency were
assessed by reviewing RTD's operating cost per hour before and during the
period of competitive contracting. The last year before competitive contracting
was 1988. Therefore, the trends in costs were reviewed for the six years before
and after this year (from 1982 through 1988 and from 1989 through 1994). The
operating cost per hour has been adjusted based on the inflation rate, using the
CPI for the Denver-Boulder area.
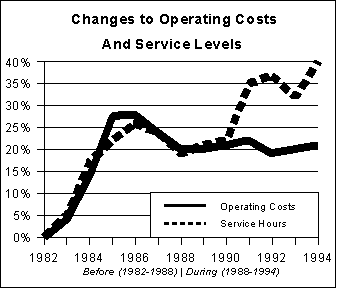
As shown in the figure The annual changes in inflation-adjusted operating costs and service levels over
both periods (from 1982 through 1994) are presented in the figure Changes to Operating Cots
and Service Levels. In the six years
prior to competitive contracting, RTD's level of service was increasing at a similar
rate as its operating costs: annual service hours increased by 17.5 percent, while
inflation-adjusted operating expenses rose by 18.8 percent. In the six years
following the introduction of competitive contracting, RTD continued to expand its
services. There was an overall increase of 18.9 percent in bus service hours
operated between 1988 and 1994. However, its inflation-adjusted operating
expenses during this same time period increased by only 1.5 percent. Essentially,
the savings from competitive contracting were sufficient to finance the continued
expansion of RTD services.
Bus Acquisition or Capital Cost Impacts
Contracts for Groups VI and VII were structured to require private operators to
supply a total of 170 new buses for the servicea in their packages. The approach
of obtaining buses through the contractors was developed because capital funds
for routine bus replacement were not readily available. RTD has an option to
purchase these buses from the contractors. Should that option be exercised, RTD
will be purchasing used buses that are between three and five years old.
A review of this approach also was conducted. The analysis indicated that this
approach is significantly more costly than if RTD had purchased the buses and
provided them to the contractors. The details of this analysis are summarized in
Table 3 and discussed below.
Table #3
The cost to purchase the buses through the contractors is comprised of two
elements: the option price and the portion of the operating cost per hour paid
throughout the contract period that can be attributable to bus payments. This
analysis has determined that RTD's average cost per bus will be $301,800 ($51.3
m for 170 buses) if purchased through the contractors. This is $15.8 million more
(44.5 percent) than if RTD had purchased the same buses itself. It represents a
unit cost of $93,000 more for each bus.
Purchasing buses through private contractors is more expensive for several
reasons. First, RTD is paying for bus depreciation at a highly accelerated rate.
Nearly $15 million in the costs paid to the contractors is attributable to the post
contract period for pre-paid capital, which is billed at an accelerated rate by the
contractors. Second, RTD is paying the contractor's financing charges and profit
margins. Profit margins are considerably higher on capital purchases than on
operating costs (usually at least six percentage points). And third, the contractors'
rates include reimbursement for costs that they incur but from which RTD is exempt,
including vehicle license fees and state purchase taxes.
CONCLUSIONS
RTD has implemented the requirements of SB 164 successfully and achieved the
desired results of the legislation. RTD already has recognized savings estimated
at $51.5 million between the start of its competitive contracting program in 1989 and
1995. It is projected to save another $36.5 million between 1996 and 1999,
assuming the current contracts remain in effect. Thus, RTD's total operating cost
savings from competitive contracting are estimated to be $88.0 million from 1989
to 1999.
The services provided by the private contractors have performed well in the quality
of service and safety-related performance indicators monitored by RTD. These
services compare well against RTD's directly-operated services. RTD's overall cost
efficiency also has improved since the introduction of competitive contracting. Prior
to the competitive contracting period, RTD service levels increased in a similar
pattern as its operating costs with annual cost increases being at a slightly higher
rate. During the competitive contracting period, however, service levels expanded
at a rate 12.6 times the increase in operating costs. Essentially, the savings from
competitive contracting were sufficient to finance the continued expansion of RTD
services.
One concern with the current contracts, however, has been the reliance on
contractors to supply new buses for RTD. These buses are used in the contracted
services and can be purchased to become part of the RTD fleet. This analysis has
shown that this provision, if exercised, will cost RTD $15.8 million more to purchase
used buses from the contractors than if it had purchased the buses directly at the
outset.
REFERENCES
1. Peskin, R.L., S.R. Mundle and S.D. Buhrer. "Transit Privatization in Denver: Experience in First Year."
Transportation Research Record 1349, TRB, National Research Council, Washington, D.C. 1992, pp. 75-84.
2. KPMG Peat Marwick and Mundle & Associates, Inc. Development of Fully-Allocated Cost Model in Compliance
with UMTA Guidelines. Working Paper 2 (Revision 3). Regional Transportation District, Denver, CO, August 1989.
3. KPMG Peat Marwick and Mundle & Associates, Inc. Modification of Fully-Allocated Cost Model to Address
Retained Functions. Working Paper 3 (Revision 2). Regional Transportation District, Denver, CO, June 1989.
| ||||||||||||||||||||||||||||||||||||||||||||||||||||||||||||||||||||||||||||||||||||||||||||||||||||||||||||||||||||||||||||||||||||||||||||||||||||||||||||||||||||||||||||||||||||


